
Page 71 - Vibrational Spectroscopic Imaging for Biomedical Applications
P. 71
Algal Cells, Cartilage, and IRENI 47
short working distance. The optional use of a low-flow-rate pump
permits to control the environs inside the chamber. As an example,
we compare high-resolution mid-IR maps of single Micrasterias sp.
algal cells acquired with a conventional and with the new flow cham-
ber. A series of PAM measurements on 35 Micrasterias sp. algae dem-
onstrate that 61 percent of the initial cells show photosynthetic
activity after 4 hours and 20 minutes. This confirms that the flow
chamber allows maintaining a substantial number of the cells alive
for an extended period of time. Next we show initial results of infra-
red images of an algal cell measured with IRENI.
2.3.4 Initial Flow Cell Measurements with IRENI
Initial measurements for an algal cell maintained under controlled,
hydrated conditions have been completed with IRENI (Ref. 37) using
the flow cell described in the previous sections of this chapter. Impor-
tantly, the increased throughput of IR provides high signal to noise
measurements and diffraction-limited spatial resolution at all wave-
lengths is achieved simultaneously. Diffraction-limited images at dif-
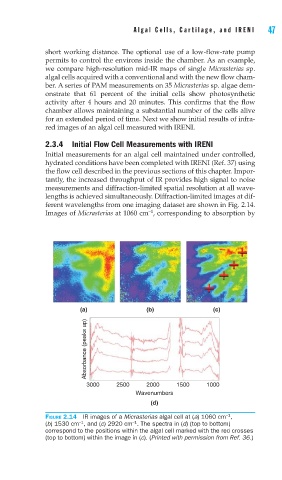
ferent wavelengths from one imaging dataset are shown in Fig. 2.14.
–1
Images of Micrasterias at 1060 cm , corresponding to absorption by
(a) (b) (c)
Absorbance (peaks up)
3000 2500 2000 1500 1000
Wavenumbers
(d)
–1
FIGURE 2.14 IR images of a Micrasterias algal cell at (a) 1060 cm ,
(b) 1530 cm , and (c) 2920 cm . The spectra in (d) (top to bottom)
–1
–1
correspond to the positions within the algal cell marked with the red crosses
(top to bottom) within the image in (c). (Printed with permission from Ref. 36.)