
Page 76 - Vibrational Spectroscopic Imaging for Biomedical Applications
P. 76
52 Cha pte r T w o
Absorbance M-CPPD Standard
Monolayer+ATP
4000 3500 3000 2500 2000 1500 1000
–1
Wavenumbers (cm )
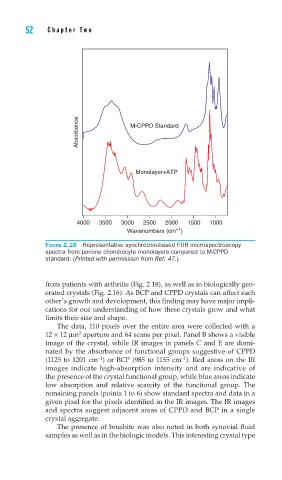
FIGURE 2.16 Representative synchrotron-based FTIR microspectroscopy
spectra from porcine chondrocyte monolayers compared to M-CPPD
standard. (Printed with permission from Ref. 47.)
from patients with arthritis (Fig. 2.18), as well as in biologically gen-
erated crystals (Fig. 2.16). As BCP and CPPD crystals can affect each
other’s growth and development, this finding may have major impli-
cations for our understanding of how these crystals grow and what
limits their size and shape.
The data, 110 pixels over the entire area were collected with a
12 × 12 μm aperture and 64 scans per pixel. Panel B shows a visible
2
image of the crystal, while IR images in panels C and E are domi-
nated by the absorbance of functional groups suggestive of CPPD
–1
–1
(1125 to 1201 cm ) or BCP (985 to 1155 cm ). Red areas on the IR
images indicate high-absorption intensity and are indicative of
the presence of the crystal functional group, while blue areas indicate
low absorption and relative scarcity of the functional group. The
remaining panels (points 1 to 6) show standard spectra and data in a
given pixel for the pixels identified in the IR images. The IR images
and spectra suggest adjacent areas of CPPD and BCP in a single
crystal aggregate.
The presence of brushite was also noted in both synovial fluid
samples as well as in the biologic models. This interesting crystal type