
Page 318 - Water and wastewater engineering
P. 318
LIME–SODA SOFTENING 7-35
where pH is in the actual hydrogen ion concentration and pH s is the pH at saturation. pH s is fur-
ther defined as
pHs pCa 2 pAlk C (7-36)
2
where pCa negative logarithm of the calcium ion concentration, moles/L
pAlk negative logarithm of the total alkalinity, equiv/L
C an empirical constant to correct for ionic strength and the temperature depen-
dence of the solubility of CaCO 3 (s)
The value of the constant for various ionic strengths (or total dissolved solids (TDS) concentra-
tions) and temperatures is given in Table 7-5 .
The state of saturation with respect to CaCO 3 depends on the LSI:
• If the LSI 0, then the solution is undersaturated and CaCO 3 will dissolve.
• If the LSI 0, the solution is at equilibrium.
• If the LSI 0, then the solution is supersaturated and CaCO 3 will precipitate.
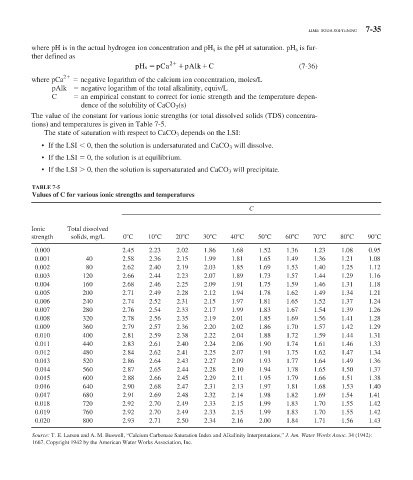
TABLE 7-5
Values of C for various ionic strengths and temperatures
C
Ionic Total dissolved
strength solids, mg/L 0 C 10 C 20 C 30 C 40 C 50 C 60 C 70 C 80 C 90 C
0.000 2.45 2.23 2.02 1.86 1.68 1.52 1.36 1.23 1.08 0.95
0.001 40 2.58 2.36 2.15 1.99 1.81 1.65 1.49 1.36 1.21 1.08
0.002 80 2.62 2.40 2.19 2.03 1.85 1.69 1.53 1.40 1.25 1.12
0.003 120 2.66 2.44 2.23 2.07 1.89 1.73 1.57 1.44 1.29 1.16
0.004 160 2.68 2.46 2.25 2.09 1.91 1.75 1.59 1.46 1.31 1.18
0.005 200 2.71 2.49 2.28 2.12 1.94 1.78 1.62 1.49 1.34 1.21
0.006 240 2.74 2.52 2.31 2.15 1.97 1.81 1.65 1.52 1.37 1.24
0.007 280 2.76 2.54 2.33 2.17 1.99 1.83 1.67 1.54 1.39 1.26
0.008 320 2.78 2.56 2.35 2.19 2.01 1.85 1.69 1.56 1.41 1.28
0.009 360 2.79 2.57 2.36 2.20 2.02 1.86 1.70 1.57 1.42 1.29
0.010 400 2.81 2.59 2.38 2.22 2.04 1.88 1.72 1.59 1.44 1.31
0.011 440 2.83 2.61 2.40 2.24 2.06 1.90 1.74 1.61 1.46 1.33
0.012 480 2.84 2.62 2.41 2.25 2.07 1.91 1.75 1.62 1.47 1.34
0.013 520 2.86 2.64 2.43 2.27 2.09 1.93 1.77 1.64 1.49 1.36
0.014 560 2.87 2.65 2.44 2.28 2.10 1.94 1.78 1.65 1.50 1.37
0.015 600 2.88 2.66 2.45 2.29 2.11 1.95 1.79 1.66 1.51 1.38
0.016 640 2.90 2.68 2.47 2.31 2.13 1.97 1.81 1.68 1.53 1.40
0.017 680 2.91 2.69 2.48 2.32 2.14 1.98 1.82 1.69 1.54 1.41
0.018 720 2.92 2.70 2.49 2.33 2.15 1.99 1.83 1.70 1.55 1.42
0.019 760 2.92 2.70 2.49 2.33 2.15 1.99 1.83 1.70 1.55 1.42
0.020 800 2.93 2.71 2.50 2.34 2.16 2.00 1.84 1.71 1.56 1.43
Source: T. E. Larson and A. M. Buswell, “Calcium Carbonate Saturation Index and Alkalinity Interpretations,” J. Am. Water Works Assoc. 34 (1942):
1667. Copyright 1942 by the American Water Works Association, Inc.