
Page 272 - Wind Energy Handbook
P. 272
246 DESIGN LOADS FOR HORIZONTAL-AXIS WIND TURBINES
1
0.9 r = 0m
0.8 Integral length scale, L = 73.5 m
Normalized correlation functions 0.6 r = 10 m Speed of rotation = 30 r.p.m.
0.7
Mean wind speed = 8 m/s
0.5
0.4
r = 20 m
0.3
Smooth curves are autocorrelation functions
0.2
Bulletted curve is cross correlation function for r 1 = 10 m and r 2 = 20 m
0.1
0
0 1 2 3 4 5
Number of rotor revolutions
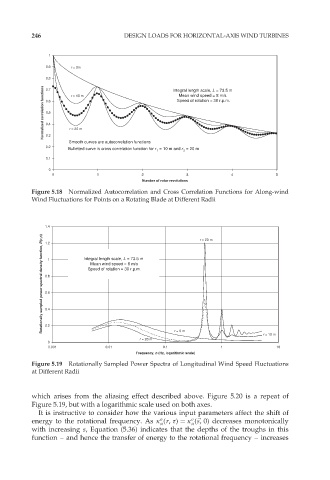
Figure 5.18 Normalized Autocorrelation and Cross Correlation Functions for Along-wind
Wind Fluctuations for Points on a Rotating Blade at Different Radii
1.4 r = 20 m
Rotationally sampled power spectral density function, R(r,n) 0.8 1 Integral length scale, L = 73.5 m
1.2
Mean wind speed = 8 m/s
Speed of rotation = 30 r.p.m.
0.6
0.4
0.2
r = 0 m
r = 10 m
r = 20 m
0
0.001 0.01 0.1 1 10
Frequency, n (Hz, logarithmic scale)
Figure 5.19 Rotationally Sampled Power Spectra of Longitudinal Wind Speed Fluctuations
at Different Radii
which arises from the aliasing effect described above. Figure 5.20 is a repeat of
Figure 5.19, but with a logarithmic scale used on both axes.
It is instructive to consider how the various input parameters affect the shift of
o
o
s
energy to the rotational frequency. As k (r, ô) ¼ k (~ s, 0) decreases monotonically
u u
with increasing s, Equation (5.36) indicates that the depths of the troughs in this
function – and hence the transfer of energy to the rotational frequency – increases