
Page 275 - Wind Energy Handbook
P. 275
BLADE LOADS DURING OPERATION 249
1
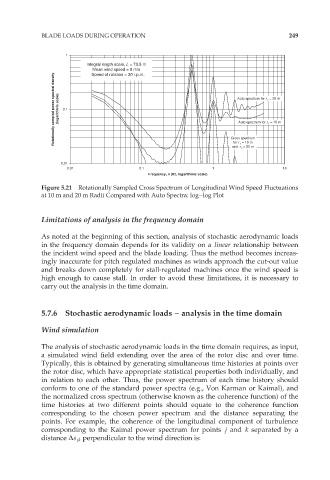
Integral length scale, L = 73.5 m
Mean wind speed = 8 m/s
Rotationally sampled power spectral density (logarithmic scale) 0.1 Auto spectrum for r 2 = 20 m
Speed of rotation = 30 r.p.m.
Auto spectrum for r 1 = 10 m
Cross spectrum
for r 1 = 10 m
and r 2 = 20 m
0.01
0.01 0.1 1 10
Frequency, n (Hz, logarithmic scale)
Figure 5.21 Rotationally Sampled Cross Spectrum of Longitudinal Wind Speed Fluctuations
at 10 m and 20 m Radii Compared with Auto Spectra: log–log Plot
Limitations of analysis in the frequency domain
As noted at the beginning of this section, analysis of stochastic aerodynamic loads
in the frequency domain depends for its validity on a linear relationship between
the incident wind speed and the blade loading. Thus the method becomes increas-
ingly inaccurate for pitch regulated machines as winds approach the cut-out value
and breaks down completely for stall-regulated machines once the wind speed is
high enough to cause stall. In order to avoid these limitations, it is necessary to
carry out the analysis in the time domain.
5.7.6 Stochastic aerodynamic loads – analysis in the time domain
Wind simulation
The analysis of stochastic aerodynamic loads in the time domain requires, as input,
a simulated wind field extending over the area of the rotor disc and over time.
Typically, this is obtained by generating simultaneous time histories at points over
the rotor disc, which have appropriate statistical properties both individually, and
in relation to each other. Thus, the power spectrum of each time history should
conform to one of the standard power spectra (e.g., Von Karman or Kaimal), and
the normalized cross spectrum (otherwise known as the coherence function) of the
time histories at two different points should equate to the coherence function
corresponding to the chosen power spectrum and the distance separating the
points. For example, the coherence of the longitudinal component of turbulence
corresponding to the Kaimal power spectrum for points j and k separated by a
distance ˜s jk perpendicular to the wind direction is: