
Page 317 - Wind Energy Handbook
P. 317
BLADE FATIGUE STRESSES 291
derived directly from the monitored signal by rainflow cycle counting. The ratio of
damage calculated by the Dirlik method to damage calculated by the rainflow
method ranged from 0.84 to 1.46, from 1.01 to 2.48 and from 0.73 to 2.34 in the three
investigations listed above, using a S=N curve exponent of 5 in each case, as the
blade structure was of steel. In view of the fact that the calculated damage rates
vary as the fifth power of the stress ranges, these results indicate that the Dirlik
method is capable of giving quite accurate results, despite the presence of the
periodic components.
There are two main drawbacks to the application of the Dirlik formula to power
spectra containing periodic components. First, the presence of large spikes in the
spectra due to the periodic components renders them very different from the
smooth distributions Dirlik originally considered, and second, information about
the relative phases of the periodic components is lost when they are transformed to
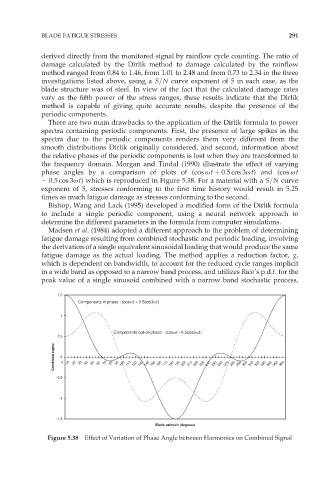
the frequency domain. Morgan and Tindal (1990) illustrate the effect of varying
phase angles by a comparison of plots of (cos øt þ 0:5 cos 3øt) and (cos øt
0:5 cos 3øt) which is reproduced in Figure 5.38. For a material with a S=N curve
exponent of 5, stresses conforming to the first time history would result in 5.25
times as much fatigue damage as stresses conforming to the second.
Bishop, Wang and Lack (1995) developed a modified form of the Dirlik formula
to include a single periodic component, using a neural network approach to
determine the different parameters in the formula from computer simulations.
Madsen et al. (1984) adopted a different approach to the problem of determining
fatigue damage resulting from combined stochastic and periodic loading, involving
the derivation of a single equivalent sinusoidal loading that would produce the same
fatigue damage as the actual loading. The method applies a reduction factor, g,
which is dependent on bandwidth, to account for the reduced cycle ranges implicit
in a wide band as opposed to a narrow band process, and utilizes Rice’s p.d.f. for the
peak value of a single sinusoid combined with a narrow band stochastic process,
1.5
Components in phase : (cosωt + 0.5cos3ωt)
1
Components out-of-phase : (cosωt - 0.5cos3ωt)
0.5
Combined signal 0 0 10 20 30 40 50 60 70 80 90 100 110 120 130 140 150 160 170 180 190 200 210 220 230 240 250 260 270 280 290 300 310 320 330 340 350 360
-0.5
-1
-1.5
Blade azimuth (degrees)
Figure 5.38 Effect of Variation of Phase Angle between Harmonics on Combined Signal