
Page 452 - Wind Energy Handbook
P. 452
426 COMPONENT DESIGN
the low-speed shaft. Figure 7.24 shows example load–duration curves (excluding
dynamic effects and braking) for two 500 kW, fixed-speed machines – one stall-
and the other pitch-regulated. The curve for the former is calculated by simply
combining the power curve with the distribution of instantaneous wind speeds,
which is obtained by superposing the turbulent variations about each mean wind
speed on the Weibull distribution of hourly means. Excursions above rated power
are not included.
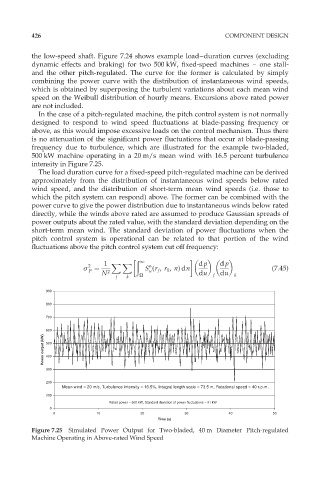
In the case of a pitch-regulated machine, the pitch control system is not normally
designed to respond to wind speed fluctuations at blade-passing frequency or
above, as this would impose excessive loads on the control mechanism. Thus there
is no attenuation of the significant power fluctuations that occur at blade-passing
frequency due to turbulence, which are illustrated for the example two-bladed,
500 kW machine operating in a 20 m/s mean wind with 16.5 percent turbulence
intensity in Figure 7.25.
The load duration curve for a fixed-speed pitch-regulated machine can be derived
approximately from the distribution of instantaneous wind speeds below rated
wind speed, and the distribution of short-term mean wind speeds (i.e. those to
which the pitch system can respond) above. The former can be combined with the
power curve to give the power distribution due to instantaneous winds below rated
directly, while the winds above rated are assumed to produce Gaussian spreads of
power outputs about the rated value, with the standard deviation depending on the
short-term mean wind. The standard deviation of power fluctuations when the
pitch control system is operational can be related to that portion of the wind
fluctuations above the pitch control system cut off frequency:
ð
1 X X 1 dp dp
2
o
ó ¼ S (r j , r k , n)dn (7:45)
P N 2 u du j du
j k Ù k
900
800
700
600
Power output (kW) 500
400
300
200
Mean wind = 20 m/s, Turbulence intensity = 16.5%, Integral length scale = 73.5 m, Rotational speed = 40 r.p.m.
100
Rated power = 500 kW, Standard deviation of power fluctuations = 91 kW
0
0 10 20 30 40 50
Time (s)
Figure 7.25 Simulated Power Output for Two-bladed, 40 m Diameter Pitch-regulated
Machine Operating in Above-rated Wind Speed