
Page 113 - Wire Bonding in Microelectronics
P. 113
92 Cha pte r F o u r
X
140 4
3
Pulling force (gf) 100 2
1
50
0
0 10 20 30 40
Rise in pulling hook (mils)
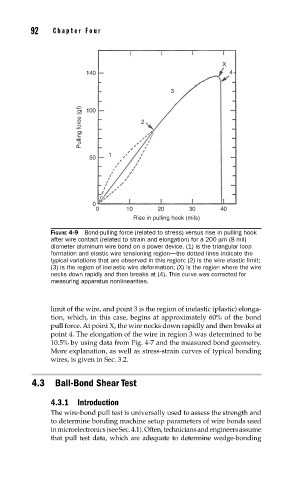
FIGURE 4-9 Bond-pulling force (related to stress) versus rise in pulling hook
after wire contact (related to strain and elongation) for a 200 µm (8 mil)
diameter aluminum wire bond on a power device. (1) is the triangular loop
formation and elastic wire tensioning region—the dotted lines indicate the
typical variations that are observed in this region; (2) is the wire elastic limit;
(3) is the region of inelastic wire deformation; (X) is the region where the wire
necks down rapidly and then breaks at (4). This curve was corrected for
measuring apparatus nonlinearities.
limit of the wire, and point 3 is the region of inelastic (plastic) elonga-
tion, which, in this case, begins at approximately 60% of the bond
pull force. At point X, the wire necks down rapidly and then breaks at
point 4. The elongation of the wire in region 3 was determined to be
10.5% by using data from Fig. 4-7 and the measured bond geometry.
More explanation, as well as stress-strain curves of typical bonding
wires, is given in Sec. 3.2.
4.3 Ball-Bond Shear Test
4.3.1 Introduction
The wire-bond pull test is universally used to assess the strength and
to determine bonding machine setup parameters of wire bonds used
in microelectronics (see Sec. 4.1). Often, technicians and engineers assume
that pull test data, which are adequate to determine wedge-bonding