
Page 155 - Wire Bonding in Microelectronics
P. 155
Gold-Aluminum Intermetallic Compounds 133
Weight percent gold
10 50 70 80 85 90 95
AuAl 2
1200
1100
1060° 1063°
1000
AuAl
Temperature (°C) 800 Au 2 Al Au 5 Al 2 Au 4 Al (Au)
900
700
660° 642° 625° 56.5 624°
600 569° 72
80
59.5 545°, ~84
500 525° 85.8
575° 775 β
400 ? ? 90
µ 94
300
0 10 20 30 40 50 60 70 80 90 100
Atomic percent gold
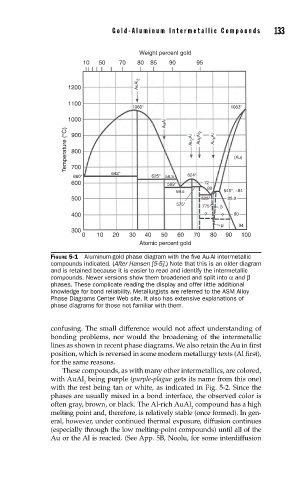
FIGURE 5-1 Aluminum-gold phase diagram with the fi ve Au-Al intermetallic
compounds indicated. (After Hansen [5-5].) Note that this is an older diagram
and is retained because it is easier to read and identify the intermetallic
compounds. Newer versions show them broadened and split into α and β
phases. These complicate reading the display and offer little additional
knowledge for bond reliability. Metallurgists are referred to the ASM Alloy
Phase Diagrams Center Web site. It also has extensive explanations of
phase diagrams for those not familiar with them.
confusing. The small difference would not affect understanding of
bonding problems, nor would the broadening of the intermetallic
lines as shown in recent phase diagrams. We also retain the Au in first
position, which is reversed in some modern metallurgy texts (Al first),
for the same reasons.
These compounds, as with many other intermetallics, are colored,
with AuAl being purple (purple-plague gets its name from this one)
2
with the rest being tan or white, as indicated in Fig. 5-2. Since the
phases are usually mixed in a bond interface, the observed color is
often gray, brown, or black. The Al-rich AuAl compound has a high
2
melting point and, therefore, is relatively stable (once formed). In gen-
eral, however, under continued thermal exposure, diffusion continues
(especially through the low melting-point compounds) until all of the
Au or the Al is reacted. (See App. 5B, Noolu, for some interdiffusion