
Page 286 - Characterization and Properties of Petroleum Fractions - M.R. Riazi
P. 286
P2: KVU/KXT
QC: —/—
T1: IML
P1: KVU/KXT
AT029-Manual-v7.cls
AT029-Manual
AT029-06
June 22, 2007
20:46
266 CHARACTERIZATION AND PROPERTIES OF PETROLEUM FRACTIONS
of bubble and dew point pressures and generation of such
Eq. (6.180) reduces to
diagrams will be discussed in Chapter 9.
(6.181) y i P = x i γ i P i sat
6.8.2.2 Solubility of Gases in Liquids—Henry’s Law
This relation also known as modified Raoult’s law is valid for
nonideal systems but at pressures of 1 atm or less where the Another important VLE relation is the relation for gas solubil-
gas phase is considered ideal gas. We know that as x i → 1 (to- ity in liquids. Many years ago it has been observed that solu-
ward a pure component) thus γ i → 1 and therefore Eq. (6.181) bility of gases in liquids (x i ) is proportional to partial pressure
reduces to Raoult’s law even for a real solution. Nonideal sys- of component in the gas phase (y i P), which can be formulated
tems with γ i > 1 show positive deviation while with γ i < 1 as [21]
show negative deviation from the Raoult’s law. One direct ap-
plication of modified Raoult’s law is to calculate composition (6.184) y i P = k i x i
of a compound in the air when it is vaporized from its pure
liquid phase (x i = 1, γ i = 1). This relation is known as Henry’s law and the proportion-
ality constant k i is called Henry’s constant. k i-solvent has the
(6.182) y i P = P sat unit of pressure per mole (or weight) fraction and for any
i
given solute and solvent system is a function of temperature.
Since for ideal gas mixtures volume and mole fractions are Henry’s law is a good approximation when pressure is low
the same therefore we have (not exceeding 5–10 bar) and the solute concentration in the
solvent, x i , is low (not exceeding 0.03) and the temperature
P sat is well below the critical temperature of solvent [21]. Henry’s
(6.183) vol% of i in air = i
P a law is exact as x i → 0. In fact through application of Gibbs–
(for vaporization of pure liquid i) Duhem equation in terms of γ i (Eq. 6.141), it can be shown
that for a binary system when Henry’s law is valid for one
where P a is atmospheric pressure. This is the same as Eq. component the Raoult’s law is valid for the other component
(2.11) that was used to calculate amount of a gas in the air for (see Problem 6.32). Equation (6.184) may be applied to gases
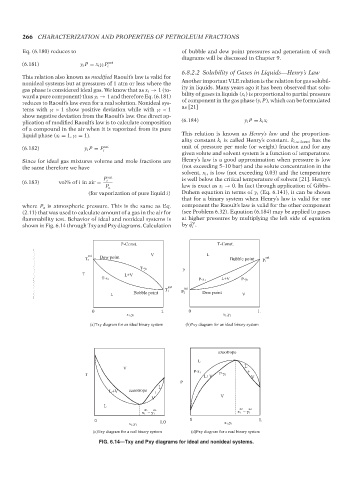
flammability test. Behavior of ideal and nonideal systems is at higher pressures by multiplying the left side of equation
V
shown in Fig. 6.14 through Txy and Pxy diagrams. Calculation by ˆ φ .
i
P-Const. T-Const.
sat V L
Dew point sat
T 2 Bubble point P 1
T-y 1
P
T L+V
T-x 1 P-x 1 L+V P-y 1
sat
T 1 P 2 sat
L Bubble point Dew point V
--`,```,`,``````,`,````,```,,-`-`,,`,,`,`,,`---
0 1. 0 1.
x 1,y 1 x 1,y 1
(a)Txy diagram for an ideal binary system (b)Pxy diagram for an ideal binary system
azeotrope
L
L
V
P-x 1 +
T P-y 1
L+V V
P
L
L+V azeotrope +
V V
L
az az az az
x 1 = y 1 x 1 = y 1
0 1.0 0 1.
x 1,y 1 x 1,y 1
(c)Txy diagram for a real binary system (d)Pxy diagram for a real binary system
FIG. 6.14—Txy and Pxy diagrams for ideal and nonideal systems.
Copyright ASTM International
Provided by IHS Markit under license with ASTM Licensee=International Dealers Demo/2222333001, User=Anggiansah, Erick
No reproduction or networking permitted without license from IHS Not for Resale, 08/26/2021 21:56:35 MDT