
Page 291 - Characterization and Properties of Petroleum Fractions - M.R. Riazi
P. 291
P2: KVU/KXT
QC: —/—
P1: KVU/KXT
June 22, 2007
AT029-Manual-v7.cls
AT029-Manual
AT029-06
20:46
Pressure, PSIA
4 50
3,000
6 7 8 9100
6 7 8 910,000
300
4 500
6 7 8 91,000
4
2
2
2
1,000 10 T1: IML 30 6. THERMODYNAMIC RELATIONS FOR PROPERTY ESTIMATIONS 271
9 9
8 8
7 7
6 6
5 5
4 4
3 3
2 2
100
9 9
8 8
7 7
6 6
5 5
4 4
3 Temperature °F 3
2 100 2
200
300-500
0 50
–50
10
9 9
8 8
7 7
6 6
5 5
--`,```,`,``````,`,````,```,,-`-`,,`,,`,`,,`---
4 4
K = y /x 3 3 K = y /x
2 2
10
9 9
8 8
7 7
6 6
5 5
4 4
3 3
2 2
0.1
9 9
8 8
7 7
6 6
5 5
4 4
3 3
2 2
0.01
10 2 30 4 50 6 7 8 9100 2 300 4 500 6 7 8 91,000 2 3,000 4 6 7 8 910,000
Pressure, PSIA Methane
CONV. PRESS. 5000 PSIA
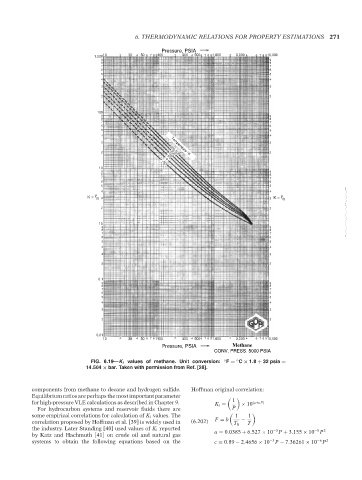
FIG. 6.19—K i values of methane. Unit conversion: ◦ F = C × 1.8 + 32 psia =
◦
14.504 × bar. Taken with permission from Ref. [28].
components from methane to decane and hydrogen sulfide. Hoffman original correlation:
Equilibrium ratios are perhaps the most important parameter
for high-pressure VLE calculations as described in Chapter 9. K i = 1 × 10 (a+cF)
For hydrocarbon systems and reservoir fluids there are P
some empirical correlations for calculation of K i values. The 1 1
correlation proposed by Hoffman et al. [39] is widely used in (6.202) F = b − T
T B
the industry. Later Standing [40] used values of K i reported −3 −5 2
by Katz and Hachmuth [41] on crude oil and natural gas a = 0.0385 + 6.527 × 10 P + 3.155 × 10 P
systems to obtain the following equations based on the c = 0.89 − 2.4656 × 10 −3 P − 7.36261 × 10 −6 P 2
Copyright ASTM International
Provided by IHS Markit under license with ASTM Licensee=International Dealers Demo/2222333001, User=Anggiansah, Erick
No reproduction or networking permitted without license from IHS Not for Resale, 08/26/2021 21:56:35 MDT