
Page 334 - Characterization and Properties of Petroleum Fractions - M.R. Riazi
P. 334
P2: IML/FFX
T1: IML
P1: IML/FFX
QC: IML/FFX
AT029-Manual-v7.cls
June 22, 2007
AT029-Manual
17:40
AT029-07
314 CHARACTERIZATION AND PROPERTIES OF PETROLEUM FRACTIONS
ASTM 10% Slope
True Vapor Pressure, psia Reid Vapor Pressure, psi Temperature, F
True Vapor Pressure of
Gasolines and Finished
Petroleum Products
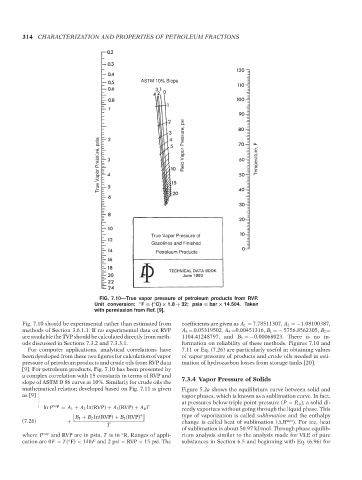
FIG. 7.10—True vapor pressure of petroleum products from RVP.
Unit conversion: ◦ F = ( C) × 1.8 + 32; psia = bar × 14.504. Taken
◦
with permission from Ref. [9].
Fig. 7.10 should be experimental rather than estimated from coefficients are given as A 1 = 7.78511307, A 2 =−1.08100387,
methods of Section 3.6.1.1. If no experimental data on RVP A 3 = 0.05319502, A 4 =0.00451316, B 1 =− 5756.8562305, B 2 =
are available the TVP should be calculated directly from meth- 1104.41248797, and B 3 =−0.00068023. There is no in-
ods discussed in Sections 7.3.2 and 7.3.3.1. formation on reliability of these methods. Figures 7.10 and
For computer applications, analytical correlations have 7.11 or Eq. (7.26) are particularly useful in obtaining values
been developed from these two figures for calculation of vapor of vapor pressure of products and crude oils needed in esti-
pressure of petroleum products and crude oils from RVP data mation of hydrocarbon losses from storage tanks [20].
[9]. For petroleum products, Fig. 7.10 has been presented by
a complex correlation with 15 constants in terms of RVP and
slope of ASTM D 86 curve at 10%. Similarly for crude oils the 7.3.4 Vapor Pressure of Solids
mathematical relation developed based on Fig. 7.11 is given Figure 5.2a shows the equilibrium curve between solid and
as [9] vapor phases, which is known as a sublimation curve. In fact,
at pressures below triple point pressure (P < P tp ), a solid di-
ln P vap = A 1 + A 2 ln(RVP) + A 3 (RVP) + A 4 T rectly vaporizes without going through the liquid phase. This
--`,```,`,``````,`,````,```,,-`-`,,`,,`,`,,`---
B 1 + B 2 ln(RVP) + B 3 (RVP)
4 type of vaporization is called sublimation and the enthalpy
(7.26) + change is called heat of sublimation ( H sub ). For ice, heat
T
of sublimation is about 50.97 kJ/mol. Through phase equilib-
where P vap and RVP are in psia, T is in R. Ranges of appli- rium analysis similar to the analysis made for VLE of pure
◦
cation are 0F < T( F) < 140F and 2 psi < RVP < 15 psi. The substances in Section 6.5 and beginning with Eq. (6.96) for
◦
Copyright ASTM International
Provided by IHS Markit under license with ASTM Licensee=International Dealers Demo/2222333001, User=Anggiansah, Erick
No reproduction or networking permitted without license from IHS Not for Resale, 08/26/2021 21:56:35 MDT