
Page 333 - Characterization and Properties of Petroleum Fractions - M.R. Riazi
P. 333
P2: IML/FFX
P1: IML/FFX
AT029-Manual
17:40
AT029-Manual-v7.cls
AT029-07
June 22, 2007
7. APPLICATIONS: ESTIMATION OF THERMOPHYSICAL PROPERTIES 313
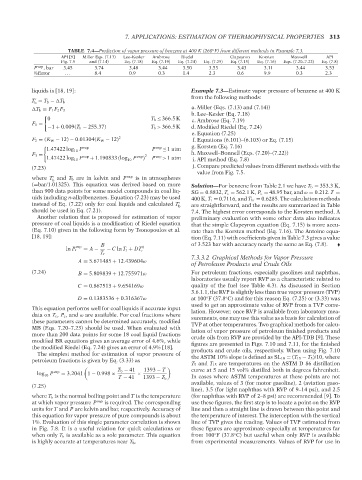
TABLE 7.4—Prediction of vapor pressure of benzene at 400 K (260 F) from different methods in Example 7.3.
Lee–Kesler
API [9] QC: IML/FFX T1: IML Ambrose Riedel ◦ Clapeyron Korsten Maxwell API
Miller Eqs. (7.13)
Fig. 7.5 and (7.14) Eq. (7.18) Eq. (7.19) Eq. (7.24) Eq. (7.25) Eq. (7.15) Eq. (7.16) Eqs. (7.20–7.22) Eq. (7.8)
P vap , bar 3.45 3.74 3.48 3.44 3.50 3.53 3.43 3.11 3.44 3.53
%Error . . . 8.4 0.9 −0.3 1.4 2.3 −0.6 −9.9 −0.3 2.3
liquids is [18, 19]: Example 7.3—Estimate vapor pressure of benzene at 400 K
from the following methods:
T = T b − T b
b
a. Miller (Eqs. (7.13) and (7.14))
T b = F 1 F 2 F 3
b. Lee–Kesler (Eq. 7.18)
0 T b ≤ 366.5K c. Ambrose (Eq. 7.19)
F 1 =
−1 + 0.009(T b − 255.37) T b > 366.5K d. Modified Riedel (Eq. 7.24)
e. Equation (7.25)
F 2 = (K W − 12) − 0.01304(K W − 12) 2 f. Equations (6.101)–(6.103) or Eq. (7.15)
1.47422 log P P ≤1 atm
vap vap g. Korsten (Eq. 7.16)
10 h. Maxwell–Bonnell (Eqs. (7.20)–(7.22))
F 3 = vap vap 2 vap
1.47422 log P + 1.190833 (log P ) P >1 atm
10 10 i. API method (Eq. 7.8)
(7.23) j. Compare predicted values from different methods with the
value from Fig. 7.5.
where T and T b are in kelvin and P vap is in atmospheres
b
(=bar/1.01325). This equation was derived based on more Solution—For benzene from Table 2.1 we have T b = 353.3 K,
than 900 data points for some model compounds in coal liq- SG = 0.8832, T c = 562.1K, P c = 48.95 bar, and ω = 0.212. T =
uids including n-alkylbenzenes. Equation (7.23) may be used 400 K, T r = 0.7116, and T br = 0.6285. The calculation methods
instead of Eq. (7.22) only for coal liquids and calculated T
b are straightforward, and the results are summarized in Table
should be used in Eq. (7.21). 7.4. The highest error corresponds to the Korsten method. A
Another relation that is proposed for estimation of vapor preliminary evaluation with some other data also indicates
pressure of coal liquids is a modification of Riedel equation that the simple Clapeyron equation (Eq. 7.15) is more accu-
(Eq. 7.10) given in the following form by Tsonopoulos et al. rate than the Korsten method (Eq. 7.16). The Antoine equa-
[18, 19]: tion (Eq. 7.11) with coefficients given in Table 7.3 gives a value
B of 3.523 bar with accuracy nearly the same as Eq. (7.8).
vap 6
ln P r = A − − C ln T r + DT r
T r
7.3.3.2 Graphical Methods for Vapor Pressure
A = 5.671485 + 12.439604ω
of Petroleum Products and Crude Oils
(7.24) B = 5.809839 + 12.755971ω For petroleum fractions, especially gasolines and naphthas,
laboratories usually report RVP as a characteristic related to
C = 0.867513 + 9.654169ω quality of the fuel (see Table 4.3). As discussed in Section
3.6.1.1, the RVP is slightly less than true vapor pressure (TVP)
D = 0.1383536 + 0.316367ω at 100 F (37.8 C) and for this reason Eq. (7.25) or (3.33) was
◦
◦
used to get an approximate value of RVP from a TVP corre-
This equation performs well for coal liquids if accurate input lation. However, once RVP is available from laboratory mea-
data on T c , P c , and ω are available. For coal fractions where surements, one may use this value as a basis for calculation of
these parameters cannot be determined accurately, modified
MB (Eqs. 7.20–7.23) should be used. When evaluated with TVP at other temperatures. Two graphical methods for calcu-
more than 200 data points for some 18 coal liquid fractions lation of vapor pressure of petroleum finished products and
modified BR equations gives an average error of 4.6%, while crude oils from RVP are provided by the API-TDB [9]. These
the modified Riedel (Eq. 7.24) gives an error of 4.9% [18]. figures are presented in Figs. 7.10 and 7.11, for the finished
The simplest method for estimation of vapor pressure of products and crude oils, respectively. When using Fig. 7.10
petroleum fractions is given by Eq. (3.33) as the ASTM 10% slope is defined as SL 10 = (T 15 − T 5 )/10, where
T 5 and T 15 are temperatures on the ASTM D 86 distillation
T b − 41 1393 − T curve at 5 and 15 vol% distilled both in degrees fahrenheit.
log 10 P vap = 3.2041 1 − 0.998 × T − 41 × 1393 − T b In cases where ASTM temperatures at these points are not
available, values of 3 (for motor gasoline), 2 (aviation gaso-
(7.25)
line), 3.5 (for light naphthas with RVP of 9–14 psi), and 2.5
where T b is the normal boiling point and T is the temperature (for naphthas with RVP of 2–8 psi) are recommended [9]. To
at which vapor pressure P vap is required. The corresponding use these figures, the first step is to locate a point on the RVP
units for T and P are kelvin and bar, respectively. Accuracy of line and then a straight line is drawn between this point and
this equation for vapor pressure of pure compounds is about the temperature of interest. The interception with the vertical
1%. Evaluation of this single parameter correlation is shown line of TVP gives the reading. Values of TVP estimated from
in Fig. 7.8. It is a useful relation for quick calculations or these figures are approximate especially at temperatures far
when only T b is available as a sole parameter. This equation from 100 F (37.8 C) but useful when only RVP is available
◦
◦
is highly accurate at temperatures near T b . from experimental measurements. Values of RVP for use in
--`,```,`,``````,`,````,```,,-`-`,,`,,`,`,,`---
Copyright ASTM International
Provided by IHS Markit under license with ASTM Licensee=International Dealers Demo/2222333001, User=Anggiansah, Erick
No reproduction or networking permitted without license from IHS Not for Resale, 08/26/2021 21:56:35 MDT