
Page 329 - Characterization and Properties of Petroleum Fractions - M.R. Riazi
P. 329
P2: IML/FFX
P1: IML/FFX
AT029-Manual
June 22, 2007
AT029-Manual-v7.cls
AT029-07
17:40
7. APPLICATIONS: ESTIMATION OF THERMOPHYSICAL PROPERTIES 309
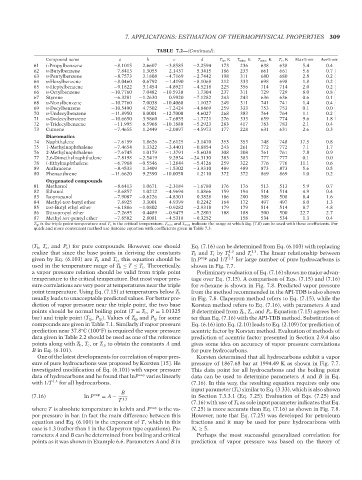
Compound name QC: IML/FFX T1: IML b TABLE 7.2—(Continued). T tp ,K T min ,K T max ,K T c , K Max% err Ave% err
d
c
a
61 i-PropyIbenzene −8.1015 2.6607 −3.8585 −2.2594 173 236 638 638 5.4 0.4
62 n-Butylbenzene −7.8413 1.3055 −2.1437 −5.3415 186 233 661 661 5.6 0.7
63 n-Pentylbenzene −8.7573 3.1808 −4.7169 −2.7442 198 311 680 680 2.8 0.2
64 n-Hexylbenzene −8.0460 0.6792 −1.4190 −8.1068 212 333 698 698 1.8 0.2
65 n-Heptylbenzene −9.1822 3.1454 −4.8927 −4.5218 225 356 714 714 2.0 0.2
66 n-Octylbenzene −10.7760 7.0482 −10.5930 1.7304 237 311 729 729 8.0 0.8 --`,```,`,``````,`,````,```,,-`-`,,`,,`,`,,`---
67 Styrene −6.3281 −1.2630 0.9920 −7.1282 243 243 636 636 0.6 0.1
68 n-Nonylbenzene −10.7760 7.0038 −10.4060 1.1027 249 311 741 741 1.4 0.4
69 n-Decylbenzene −10.5490 4.7502 −7.2424 −4.8469 259 333 753 753 0.1 0.0
70 n-Undecylbenzene −11.8950 8.0001 −12.7000 4.6027 268 383 764 764 1.1 0.2
71 n-Dodecylbenzene −10.6650 3.9860 −7.6855 −1.7721 276 333 659 774 9.6 1.8
72 n-Tridecylbenzene −11.995 6.5968 −10.1880 −5.2923 283 417 783 783 2.1 0.4
73 Cumene −7.4655 1.2449 −2.0897 −4.5973 177 228 631 631 2.6 0.3
Diaromatics
74 Naphthalene −7.6159 1.8626 −2.6125 −3.1470 353 353 748 748 17.5 0.8
75 1-Methylnaphthalene −7.4654 1.3322 −3.4401 −0.8854 243 261 772 772 7.1 1.7
76 2-Methylnaphthalene −7.6745 1.0179 −1.3791 −5.6038 308 308 761 761 7.8 0.9
77 2,6-Dimethylnaphthalene −7.8198 −2.5419 9.2934 −24.3130 383 383 777 777 0.1 0.0
78 i-Ethylnaphthalene −6.7968 −0.5546 −1.2844 −5.4126 259 322 776 776 11.1 0.6
89 Anthracene −8.4533 1.3409 −1.5302 −3.9310 489 489 873 873 5.6 0.5
80 Phenanthrene −11.6620 9.2590 −10.0050 1.2110 372 372 869 869 1.0 0.2
Oxygenated compounds
81 Methanol −8.6413 1.0671 −2.3184 −1.6780 176 176 513 513 5.9 0.7
82 Ethanol −8.6857 1.0212 −4.9694 1.8866 159 194 514 514 4.9 0.4
83 Isopropanol −7.9087 −0.6226 −4.8301 0.3828 186 200 508 508 8.4 1.6
84 Methyl-tert-butyl ether −7.8925 3.3001 −4.9399 0.2242 164 172 497 497 8.0 1.3
85 tert-Butyl ethyl ether −6.1886 −1.0802 −0.9282 −2.9318 179 179 514 514 8.7 4.8
86 Diisopropyl ether −7.2695 0.4489 −0.9475 −5.2803 188 188 500 500 22.7 2.7
87 Methyl tert-pentyl ether −7.8502 2.8081 −4.5318 −0.3252 158 534 534 1.3 0.4
T tp is the triple point temperature and T c is the critical temperature. T min and T max indicate the range at which Eq. (7.8) can be used with these coefficients. For
quick and more convenient method use Antoine equation with coefficients given in Table 7.3.
(T b , T c , and P c ) for pure compounds. However, one should Eq. (7.16) can be determined from Eq. (6.103) with replacing
realize that since the base points in deriving the constants T b and T c by T b 1.3 and T c 1.3 . The linear relationship between
given by Eq. (6.103) are T b and T c , this equation should be ln P vap and 1/T 1.3 for large number of pure hydrocarbons is
used in the temperature range of T b ≤ T ≤ T c . Theoretically, shown in Fig. 7.7.
a vapor pressure relation should be valid from triple point Preliminary evaluation of Eq. (7.16) shows no major advan-
temperature to the critical temperature. But most vapor pres- tage over Eq. (7.15). A comparison of Eqs. (7.15) and (7.16)
sure correlations are very poor at temperatures near the triple for n-hexane is shown in Fig. 7.8. Predicted vapor pressure
point temperature. Using Eq. (7.15) at temperatures below T b from the method recommended in the API-TDB is also shown
usually leads to unacceptable predicted values. For better pre- in Fig. 7.8. Clapeyron method refers to Eq. (7.15), while the
diction of vapor pressure near the triple point, the two base Korsten method refers to Eq. (7.16), with parameters A and
points should be normal boiling point (T = T b , P = 1.01325 B determined from T b , T c , and P c . Equation (7.15) agrees bet-
bar) and triple point (T tp , P tp ). Values of T tp and P tp for some ter than Eq. (7.16) with the API-TDB method. Substitution of
compounds are given in Table 7.1. Similarly if vapor pressure Eq. (6.16) into Eq. (2.10) leads to Eq. (2.109) for prediction of
prediction near 37.8 C (100 F) is required the vapor pressure acentric factor by Korsten method. Evaluation of methods of
◦
◦
data given in Table 2.2 should be used as one of the reference prediction of acentric factor presented in Section 2.9.4 also
points along with T b , T c ,or T tp to obtain the constants A and gives some idea on accuracy of vapor pressure correlations
B in Eq. (6.101). for pure hydrocarbons.
One of the latest developments for correlation of vapor pres- Korsten determined that all hydrocarbons exhibit a vapor
sure of pure hydrocarbons was proposed by Korsten [15]. He pressure of 1867.68 bar at 1994.49 K as shown in Fig. 7.7.
investigated modification of Eq. (6.101) with vapor pressure This data point for all hydrocarbons and the boiling point
data of hydrocarbons and he found that lnP vap varies linearly data can be used to determine parameters A and B in Eq.
with 1/T 1.3 for all hydrocarbons. (7.16). In this way, the resulting equation requires only one
input parameter (T b ) similar to Eq. (3.33), which is also shown
B
vap
(7.16) ln P = A − in Section 7.3.3.1 (Eq. 7.25). Evaluation of Eqs. (7.25) and
T 1.3
(7.16) with use of T b as sole input parameter indicates that Eq.
where T is absolute temperature in kelvin and P vap is the va- (7.25) is more accurate than Eq. (7.16) as shown in Fig. 7.8.
por pressure in bar. In fact the main difference between this However, note that Eq. (7.25) was developed for petroleum
equation and Eq. (6.101) is the exponent of T, which in this fractions and it may be used for pure hydrocarbons with
case is 1.3 (rather than 1 in the Clapeyron type equations). Pa- N c ≥ 5.
rameters A and B can be determined from boiling and critical Perhaps the most successful generalized correlation for
points as it was shown in Example 6.6. Parameters A and B in prediction of vapor pressure was based on the theory of
Copyright ASTM International
Provided by IHS Markit under license with ASTM Licensee=International Dealers Demo/2222333001, User=Anggiansah, Erick
No reproduction or networking permitted without license from IHS Not for Resale, 08/26/2021 21:56:35 MDT