
Page 130 - Petroleum Production Engineering, A Computer-Assisted Approach
P. 130
Guo, Boyun / Computer Assited Petroleum Production Engg 0750682701_chap10 Final Proof page 125 4.1.2007 8:26pm Compositor Name: SJoearun
SEPARATION SYSTEMS 10/125
where the liquid water reduces the water content of the gas.
Water content of untreated natural gases is normally in
R p ¼ pressure ratio the magnitude of a few hundred pounds of water per
N st ¼ number of stages 1 million standard cubic foot of gas (lb m =MMscf); while
p 1 ¼ first-stage or high-pressure separator pressure, psia gas pipelines normally require water content to be in the
p s ¼ stock-tank pressure, psia range of 6---8 lb m =MMscf and even lower for offshore
pipelines.
Pressures at the intermediate stages can then be designed
with the following formula: The water content of natural gas is indirectly indicated
by the ‘‘dew point,’’ defined as the temperature at which
p i 1
p i ¼ , (10:6) the natural gas is saturated with water vapor at a given
R p pressure. At the dew point, natural gas is in equilibrium
where p i ¼ pressure at stage i, psia. with liquid water; any decrease in temperature or increase
in pressure will cause the water vapor to begin condensing.
The difference between the dew point temperature of a
water-saturated gas stream and the same stream after it
10.3 Dehydration System has been dehydrated is called ‘‘dew-point depression.’’
All natural gas downstream from the separators still con- It is essential to accurately estimate the saturated water
tain water vapor to some degree. Water vapor is probably vapor content of natural gas in the design and operation of
the most common undesirable impurity found in the dehydration equipment. Several methods are available for
untreated natural gas. The main reason for removing this purpose including the correlations of McCarthy et al.
water vapor from natural gas is that water vapor becomes (1950) and McKetta and Wehe (1958). Dalton’s law of
liquid water under low-temperature and/or high-pressure partial pressures is valid for estimating water vapor con-
conditions. Specifically, water content can affect long- tent of gas at near-atmospheric pressures. Readings from
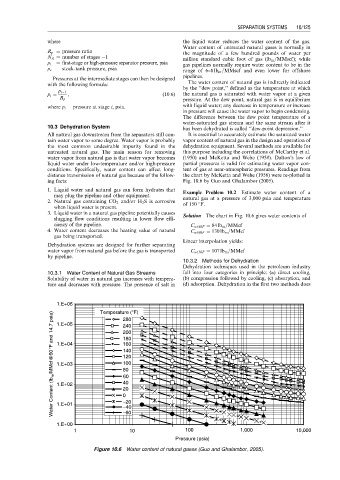
distance transmission of natural gas because of the follow- the chart by McKetta and Wehe (1958) were re-plotted in
ing facts: Fig. 10.6 by Guo and Ghalambor (2005).
1. Liquid water and natural gas can form hydrates that Example Problem 10.2 Estimate water content of a
may plug the pipeline and other equipment. natural gas at a pressure of 3,000 psia and temperature
2. Natural gas containing CO 2 and/or H 2 S is corrosive of 150 8F.
when liquid water is present.
3. Liquid water in a natural gas pipeline potentially causes Solution The chart in Fig. 10.6 gives water contents of
slugging flow conditions resulting in lower flow effi-
ciency of the pipeline. C w140F ¼ 84 lb m =MMcf
4. Water content decreases the heating value of natural C w160F ¼ 130 lb m =MMcf
gas being transported.
Linear interpolation yields:
Dehydration systems are designed for further separating
water vapor from natural gas before the gas is transported C w150F ¼ 107 lb m =MMcf
by pipeline.
10.3.2 Methods for Dehydration
Dehydration techniques used in the petroleum industry
10.3.1 Water Content of Natural Gas Streams fall into four categories in principle: (a) direct cooling,
Solubility of water in natural gas increases with tempera- (b) compression followed by cooling, (c) absorption, and
ture and decreases with pressure. The presence of salt in (d) adsorption. Dehydration in the first two methods does
1.E+06 Temperature ( F)
Water Content (lb m /MMcf@60 F and 14.7 psia) 1.E+04 180
280
1.E+05
240
200
160
140
120
100
1.E+03
80
60
40
1.E+02
20
1.E+01
−40
−60
1.E+00 0 −20
1 10 100 1,000 10,000
Pressure (psia)
Figure 10.6 Water content of natural gases (Guo and Ghalambor, 2005).