
Page 129 - 3D Fibre Reinforced Polymer Composites
P. 129
118 30 Fibre Reinforced Polymer Composites
orthogonal woven CFRP (as shown in Figure 5.6) and a 3D orthogonal woven E-
glasdepoxy composite. Figure 5.12 shows micrographs of the fiacture surface for
specimens loaded in the stuffer yam and filler direction, respectively. The breakage of
z-binders shown in Figures 5.12(a) and (b) indicate that stuffer yams break at a cross
section between two adjacent six filler yams. The separation of a z-binder shown in
Figures 5.12(c) and (d) clearly indicates that filler yarns break at a cross section along a
z-binder .
0
0
- t b 0
.-
a,
W
E 0.75 a 0
? 9,
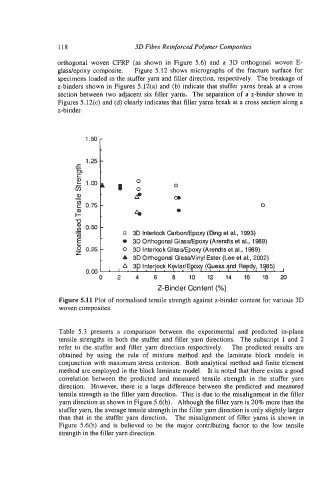
3D Interlock CarbonEpoxy (Ding et al., 1993)
3D Orthogonal Glass/Epoxy (Arendts et al., 1989)
30 Interlock GlasdEpoxy (Arendts et al., 1989)
3D Orthogonal GlassNinyl Ester (Lee et al., 2002)
A 3D Interlock Kevlar/Epxy (Guess and Reedy, 1985)
0.00 ' I ' I ' I "
'
0 2 4 6 8 10 12 14 16 18 20
Z-Binder Content (%)
Figure 5.11 Plot of normalised tensile strength against z-binder content for various 3D
woven composites.
Table 5.3 presents a comparison between the experimental and predicted in-plane
tensile strengths in both the stuffer and filler yam directions. The subscript 1 and 2
refer to the stuffer and filler yarn direction respectively. The predicted results are
obtained by using the rule of mixture method and the laminate block models in
conjunction with maximum stress criterion. Both analytical method and finite element
method are employed in the block laminate model. It is noted that there exists a good
correlation between the predicted and measured tensile strength in the stuffer yarn
direction. However, there is a large difference between the predicted and measured
tensile strength in the filler yam direction. This is due to the misalignment in the filler
yam direction as shown in Figure 5.6(b). Although the filler yam is 20% more than the
stuffer yarn, the average tensile strength in the filler yarn direction is only slightly larger
than that in the stuffer yarn direction. The misalignment of filler yarns is shown in
Figure 5.6(b) and is believed to be the major contributing factor to the low tensile
strength in the filler yarn direction.