
Page 131 - 3D Fibre Reinforced Polymer Composites
P. 131
120 30 Fibre Reinforced Polymer Composites
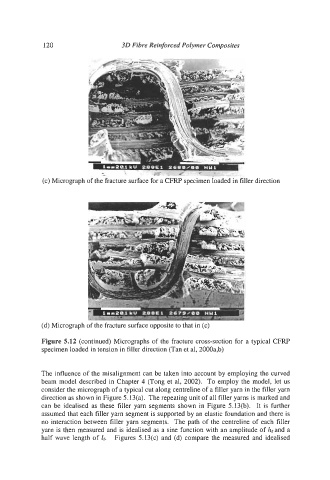
(c) Micrograph of the fracture surface for a CFW specimen loaded in tiller direction
(d) Micrograph of the fracture surface opposite to that in (c)
Figure 5.12 (continued) Micrographs of the fracture cross-section for a typical CFRP
specimen loaded in tension in filler direction (Tan et al, 2000a,b)
The influence of the misalignment can be taken into account by employing the curved
beam model described in Chapter 4 (Tong et al, 2002). To employ the model, let us
consider the micrograph of a typical cut along centreline of a filler yarn in the filler yarn
direction as shown in Figure 5.13(a). The repeating unit of all filler yarns is marked and
can be idealised as these filler yarn segments shown in Figure 5.13(b). It is further
assumed that each filler yarn segment is supported by an elastic foundation and there is
no interaction between filler yarn segments. The path of the centreline of each filler
yarn is then measured and is idealised as a sine function with an amplitude of hfand a
half wave length of If. Figures 5.13(c) and (d) compare the measured and idealised