
Page 133 - 3D Fibre Reinforced Polymer Composites
P. 133
122 30 Fibre Reinforced Polymer Composites
0 0.2 0.4 0.6 0.8 1 1.2
0
-0.01
-0.02
- -0.03
E
-
E -0.04
v
-3 -0.05
' -0.06
-0.07
-0.08
-0.09 I
Location y (mm)
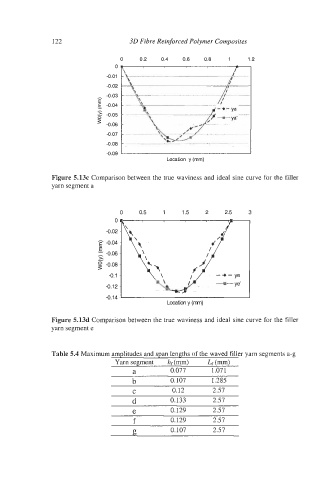
Figure 5.13~ Comparison between the true waviness and ideal sine curve for the filler
yarn segment a
0 0.5 1 1.5 2 2.5 3
0
-0.02
-0.04
E
,V -0.06
%
Y
-0.08
-0.1
-0.12
-0.14
Location y (rnrn)
Figure 5.13d Comparison between the true waviness and ideal sine curve for the filler
yarn segment e
Table 5.4 Maximum amplitudes and span lengths of the waved filler yarn segments a-g
Yarn segment hf(mm) Lf (mm)
a 0.077 1.07 1
b 0.107 1.285
C 0.12 2.57
d 0.133 2.57
e 0.129 2.57
f 0.129 2.57
g 0.107 2.57