
Page 106 - Acquisition and Processing of Marine Seismic Data
P. 106
2.3 3D MARINE SEISMIC ACQUISITION 97
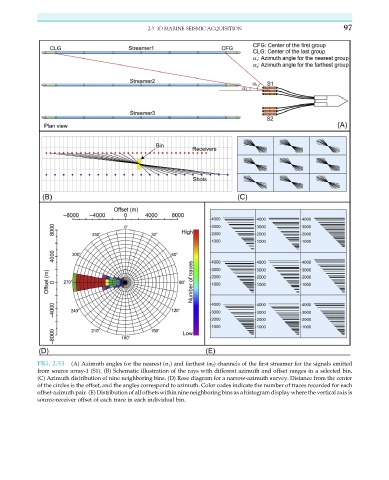
FIG. 2.53 (A) Azimuth angles for the nearest (α 1 ) and farthest (α 2 ) channels of the first streamer for the signals emitted
from source array-1 (S1). (B) Schematic illustration of the rays with different azimuth and offset ranges in a selected bin.
(C) Azimuth distribution of nine neighboring bins. (D) Rose diagram for a narrow-azimuth survey. Distance from the center
of the circles is the offset, and the angles correspond to azimuth. Color codes indicate the number of traces recorded for each
offset-azimuth pair. (E) Distribution of all offsets within nine neighboring bins as a histogram display where the vertical axis is
source-receiver offset of each trace in each individual bin.