
Page 132 - Adsorbents fundamentals and applications
P. 132
CARBON MOLECULAR SIEVES 117
on CMS’s is possibly due to higher heterogeneity of the CMS’s. The diffusion
time constants (Chen et al., 1994) are shown in Figure 5.25. These diffusion
time constants have also been measured by a number of groups. As noted by
Chen et al. (1994), those groups used activation conditions (prior to diffusion
measurements) similar to those used for zeolite activation, and consequently
higher diffusion time constants (by an order of magnitude) were obtained due
to pore enlargement by high-temperature activation. A further discussion will be
given later on sorbents for air separation.
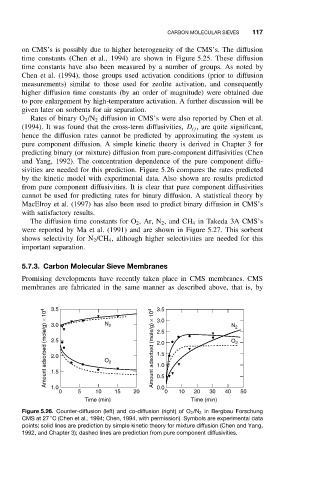
Rates of binary O 2 /N 2 diffusion in CMS’s were also reported by Chen et al.
(1994). It was found that the cross-term diffusivities, D ij , are quite significant,
hence the diffusion rates cannot be predicted by approximating the system as
pure component diffusion. A simple kinetic theory is derived in Chapter 3 for
predicting binary (or mixture) diffusion from pure-component diffusivities (Chen
and Yang, 1992). The concentration dependence of the pure component diffu-
sivities are needed for this prediction. Figure 5.26 compares the rates predicted
by the kinetic model with experimental data. Also shown are results predicted
from pure component diffusivities. It is clear that pure component diffusivities
cannot be used for predicting rates for binary diffusion. A statistical theory by
MacElroy et al. (1997) has also been used to predict binary diffusion in CMS’s
with satisfactory results.
The diffusion time constants for O 2 ,Ar, N 2 ,and CH 4 in Takeda 3A CMS’s
were reported by Ma et al. (1991) and are shown in Figure 5.27. This sorbent
shows selectivity for N 2 /CH 4 , although higher selectivities are needed for this
important separation.
5.7.3. Carbon Molecular Sieve Membranes
Promising developments have recently taken place in CMS membranes. CMS
membranes are fabricated in the same manner as described above, that is, by
3.5
3.5
Amount adsorbed (mole/g) × 10 4 3.0 N 2 Amount adsorbed (mole/g) × 10 4 3.0 N 2
2.5
2.5
2.0
O 2
1.5
2.0
O 2
1.0
1.5
0.0
1.0
0 5 10 15 20 0.5 0 10 20 30 40 50
Time (min) Time (min)
Figure 5.26. Counter-diffusion (left) and co-diffusion (right) of O 2 /N 2 in Bergbau Forschung
◦
CMS at 27 C (Chen et al., 1994; Chen, 1994, with permission). Symbols are experimental data
points; solid lines are prediction by simple kinetic theory for mixture diffusion (Chen and Yang,
1992, and Chapter 3); dashed lines are prediction from pure component diffusivities.