
Page 348 - Adsorbents fundamentals and applications
P. 348
OLEFIN/PARAFFIN SEPARATIONS 333
the lower desorption pressure (0.2 atm.), runs 11 and 15 clearly demonstrate the
superiority of AgNO /SiO 2 sorbent. All the three parameters, namely the product
3
purity, recovery, and throughput for AgNO /SiO 2 exceeded that for AlPO 4 -14.
3
The feed pressure was taken arbitrarily at 7 atm in the above simulation.
The available pressures in the refinery gas streams and the purge streams from
polyolefin reactors are higher than 7 atm. At higher feed pressures, the PSA
performance with AgNO /SiO 2 will continue to improve because more olefin will
3
be adsorbed, whereas that with AlPO 4 -14 will not improve because its capacity
is already saturated.
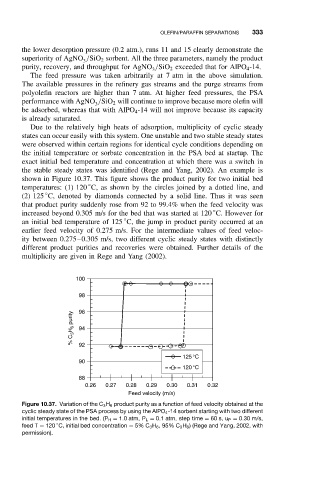
Due to the relatively high heats of adsorption, multiplicity of cyclic steady
states can occur easily with this system. One unstable and two stable steady states
were observed within certain regions for identical cycle conditions depending on
the initial temperature or sorbate concentration in the PSA bed at startup. The
exact initial bed temperature and concentration at which there was a switch in
the stable steady states was identified (Rege and Yang, 2002). An example is
shown in Figure 10.37. This figure shows the product purity for two initial bed
◦
temperatures: (1) 120 C, as shown by the circles joined by a dotted line, and
◦
(2) 125 C, denoted by diamonds connected by a solid line. Thus it was seen
that product purity suddenly rose from 92 to 99.4% when the feed velocity was
◦
increased beyond 0.305 m/s for the bed that was started at 120 C. However for
◦
an initial bed temperature of 125 C, the jump in product purity occurred at an
earlier feed velocity of 0.275 m/s. For the intermediate values of feed veloc-
ity between 0.275–0.305 m/s, two different cyclic steady states with distinctly
different product purities and recoveries were obtained. Further details of the
multiplicity are given in Rege and Yang (2002).
100
98
% C 3 H 6 purity 96
94
92
125°C
90
120°C
88
0.26 0.27 0.28 0.29 0.30 0.31 0.32
Feed velocity (m/s)
Figure 10.37. Variation of the C 3 H 6 product purity as a function of feed velocity obtained at the
cyclic steady state of the PSA process by using the AlPO 4 -14 sorbent starting with two different
initial temperatures in the bed. (P H = 1.0atm, P L = 0.1 atm, step time = 60 s, u P = 0.30 m/s,
◦
feed T = 120 C, initial bed concentration = 5% C 3 H 6 , 95% C 3 H 8 ) (Rege and Yang, 2002, with
permission).