
Page 341 - Adsorption, Ion Exchange & Catalysis- 2007, Elsevier - Copy
P. 341
Else_AIEC-INGLE_cH004.qxd 7/1/2006 6:54 PM Page 337
4.2 Design of Adsorption and Ion-Exchange Processes 337
the corresponding elapsed times. Then the ( T – 1) v ersus C / C o curve is constructed, where
C is the e xit concentration, C o is the inlet concentration, and T is the dimensionless time
modulus.
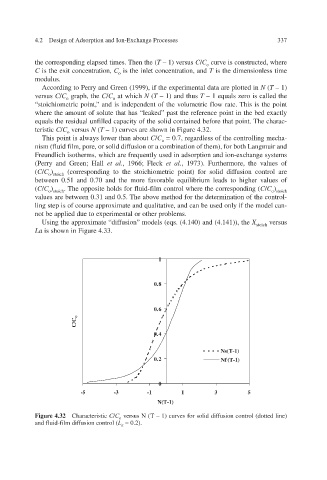
According to Perry and Green (1999), if the experimental data are plotted in N ( T – 1)
versus C / C o graph, the C / C o at which N ( T – 1) and thus T – 1 equals zero is called the
”
“stoichiometric point, and is independent of the volumetric flow rate. This is the point
ed”
where the amount of solute that has “leak past the reference point in the bed e xactly
equals the residual unfilled capacity of the solid contained before that point. The charac-
teristic C / C o versus N ( T – 1) curves are shown in Figure 4.32.
This point is alays lower than about w C / C o = 0.7, regardless of the controlling mecha-
nism (fluid film, pore, or solid diffor both Langmuir and fusion or a combination of them),
Freundlich isotherms, which are frequently used in adsorption and ion-exchange systems
(Perry and Green; Hall et al ., 1966; Fleck et al ., 1973). Furthermore, the values of
( C / C ) o stoich (corresponding to the stoichiometric point) for solid diffusion control are
v
between 0.51 and 0.70 and the more forable equilibrium leads to higher values of
a
( C / C ) o stoich . The opposite holds for fluid-film control where the corresponding ( C / C ) o stoich
values are between 0.31 and 0.5. The aboe method for the determination of the control- v
v
ling step is of course approximate and qualitati and can be used only if the model can-
e,
not be applied due to experimental or other problems.
Using the approximate “dif models (eqs. (4.140) and (4.141)), the X stoich versus
fusion”
La is shown in Figure 4.33.
1
0.8
0.6
o
C/C
0.4
Ns(T-1)
0.2 Nf (T-1)
0
-5 -3 -1 1 3 5
N(T-1)
Figure 4.32 Characteristic C / C versus N (T – 1) curves for solid diffusion control (dotted line)
o
and fluid-film diffusion control ( L = 0.2).
a