
Page 446 - Advanced thermodynamics for engineers
P. 446
436 CHAPTER 18 LIQUEFACTION OF GASES
10
Joule–Thomson cooling cannot occur in this region
8 Joule–Thomson coefficient
Reduced pressure, p R / bar 6 4 Joule–Thomson coefficient positive
negative in this region
in this region
2
Saturation
line
0
0 1 2 3 4 5 6 7
Reduced temperature, T / K
R
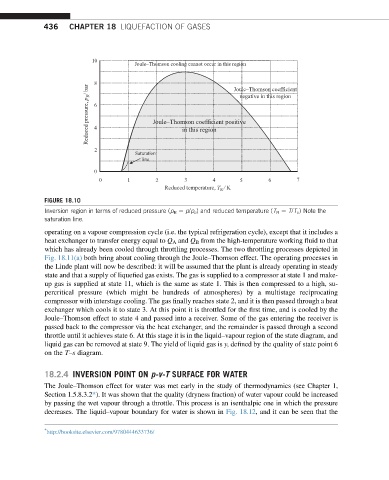
FIGURE 18.10
Inversion region in terms of reduced pressure (p R ¼ p/p c ) and reduced temperature (T R ¼ T/T c ) Note the
saturation line.
operating on a vapour compression cycle (i.e. the typical refrigeration cycle), except that it includes a
heat exchanger to transfer energy equal to Q A and Q B from the high-temperature working fluid to that
which has already been cooled through throttling processes. The two throttling processes depicted in
Fig. 18.11(a) both bring about cooling through the Joule–Thomson effect. The operating processes in
the Linde plant will now be described: it will be assumed that the plant is already operating in steady
state and that a supply of liquefied gas exists. The gas is supplied to a compressor at state 1 and make-
up gas is supplied at state 11, which is the same as state 1. This is then compressed to a high, su-
percritical pressure (which might be hundreds of atmospheres) by a multistage reciprocating
compressor with interstage cooling. The gas finally reaches state 2, and it is then passed through a heat
exchanger which cools it to state 3. At this point it is throttled for the first time, and is cooled by the
Joule–Thomson effect to state 4 and passed into a receiver. Some of the gas entering the receiver is
passed back to the compressor via the heat exchanger, and the remainder is passed through a second
throttle until it achieves state 6. At this stage it is in the liquid–vapour region of the state diagram, and
liquid gas can be removed at state 9. The yield of liquid gas is y, defined by the quality of state point 6
on the T–s diagram.
18.2.4 INVERSION POINT ON p-v-T SURFACE FOR WATER
The Joule–Thomson effect for water was met early in the study of thermodynamics (see Chapter 1,
Section 1.5.8.3.2*). It was shown that the quality (dryness fraction) of water vapour could be increased
by passing the wet vapour through a throttle. This process is an isenthalpic one in which the pressure
decreases. The liquid–vapour boundary for water is shown in Fig. 18.12, and it can be seen that the
*
http://booksite.elsevier.com/9780444633736/