
Page 447 - Advanced thermodynamics for engineers
P. 447
18.2 LIQUEFACTION BY EXPANSION – METHOD (II) 437
(a)
(b)
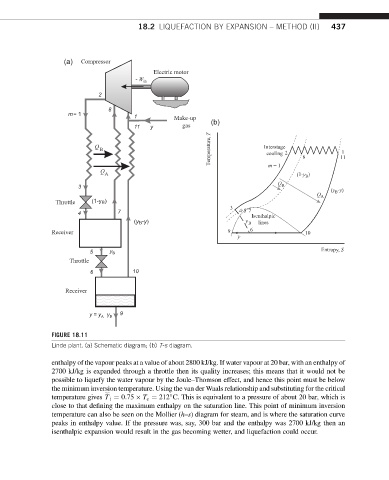
FIGURE 18.11
Linde plant. (a) Schematic diagram; (b) T-s diagram.
enthalpy of the vapour peaks at a value of about 2800 kJ/kg. If water vapour at 20 bar, with an enthalpy of
2700 kJ/kg is expanded through a throttle then its quality increases; this means that it would not be
possible to liquefy the water vapour by the Joule–Thomson effect, and hence this point must be below
the minimum inversion temperature. Using the van der Waals relationship and substituting for the critical
^
temperature gives T i ¼ 0:75 T c ¼ 212 C. This is equivalent to a pressure of about 20 bar, which is
close to that defining the maximum enthalpy on the saturation line. This point of minimum inversion
temperature can also be seen on the Mollier (h–s) diagram for steam, and is where the saturation curve
peaks in enthalpy value. If the pressure was, say, 300 bar and the enthalpy was 2700 kJ/kg then an
isenthalpic expansion would result in the gas becoming wetter, and liquefaction could occur.