
Page 401 - Advances in Biomechanics and Tissue Regeneration
P. 401
398 20. BIOMECHANICAL ANALYSIS OF BONE TISSUE SURROUNDING DENTAL IMPLANTS
being σ 11min ¼min(σ 11 ), σ 11max ¼max(σ 11 ), and 4σ 11 ¼σ 11max σ 11min . In Eqs. (20.6), (20.7), it is shown that the resorp-
tion group includes the integration points with the lowest values of σ 11 and the formation group has the integration
points with the highest values of σ 11 . Only the integration points belonging to R(x I )or F(x I ) will have a new apparent
density, being parameters α and β the decay and growth rate of apparent density, respectively. The remaining inte-
gration points are included in the lazy group in which their apparent density will remain the same during that
iteration step.
The next step is to update the apparent density using the phenomenological law proposed by Belinha et al. [21]. This
law classifies bone architecture according to the apparent density, ρ, considering trabecular bone when ρ 1.3 g/cm 3
3
and cortical bone when ρ>1.3 g/cm . Based on experimental works performed by Zioupos et al. [22], the following
mathematical expressions were proposed by Belinha et al. [21]:
3
X j
a j ρ (20.8)
σ ¼
j¼0
8
3
X
> j 3
> b j ρ if ρ 1:3g=cm
>
>
>
j¼0
<
(20.9)
3
E ¼
>
X
> j 3
> c j ρ
> if ρ > 1:3g=cm
>
:
j¼0
The von Mises effective stress, σ, and the elasticity modulus, E, are expressed in MPa, whereas apparent density, ρ,is
3
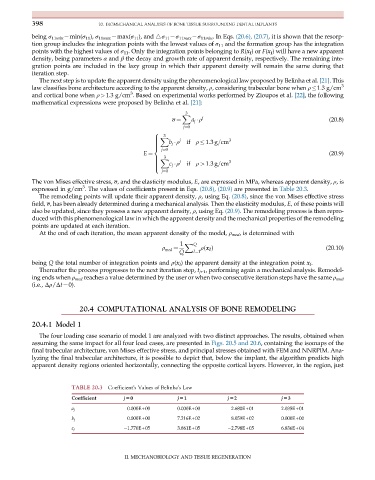
expressed in g/cm . The values of coefficients present in Eqs. (20.8), (20.9) are presented in Table 20.3.
The remodeling points will update their apparent density, ρ, using Eq. (20.8), since the von Mises effective stress
field, σ, has been already determined during a mechanical analysis. Then the elasticity modulus, E, of these points will
also be updated, since they possess a new apparent density, ρ, using Eq. (20.9). The remodeling process is then repro-
duced with this phenomenological law in which the apparent density and the mechanical properties of the remodeling
points are updated at each iteration.
At the end of each iteration, the mean apparent density of the model, ρ med , is determined with
1 X Q
ρ med ρ x I (20.10)
Q I¼1 ðÞ
¼
being Q the total number of integration points and ρ(x I ) the apparent density at the integration point x I .
Thereafter the process progresses to the next iteration step, t j+1 , performing again a mechanical analysis. Remodel-
ing ends when ρ med reaches a value determined by the user or when two consecutive iteration steps have the same ρ med
(i.e., Δρ/Δt¼0).
20.4 COMPUTATIONAL ANALYSIS OF BONE REMODELING
20.4.1 Model 1
The four loading case scenario of model 1 are analyzed with two distinct approaches. The results, obtained when
assuming the same impact for all four load cases, are presented in Figs. 20.5 and 20.6, containing the isomaps of the
final trabecular architecture, von Mises effective stress, and principal stresses obtained with FEM and NNRPIM. Ana-
lyzing the final trabecular architecture, it is possible to depict that, below the implant, the algorithm predicts high
apparent density regions oriented horizontally, connecting the opposite cortical layers. However, in the region, just
TABLE 20.3 Coefficient’s Values of Belinha’s Law
Coefficient j50 j51 j52 j53
a j 0.000E+00 0.000E+00 2.680E+01 2.035E+01
b j 0.000E+00 7.216E+02 8.059E+02 0.000E+00
c j 1.770E+05 3.861E+05 2.798E+05 6.836E+04
II. MECHANOBIOLOGY AND TISSUE REGENERATION