
Page 309 - Advances in Renewable Energies and Power Technologies
P. 309
282 CHAPTER 8 Hybrid PV/Batteries Bank/Diesel Generator
20.5
dod=0.7
15.5
dod=0.75
Load (Kw) 10.5 dod=0.78
dod=0.79
5.5
0.5
0 50 100 150 200 250 300 350 400 450
Estimated time for dod values at 0.70, 0.75, 0.78 and 0.79 to
reach dod value of 0.8
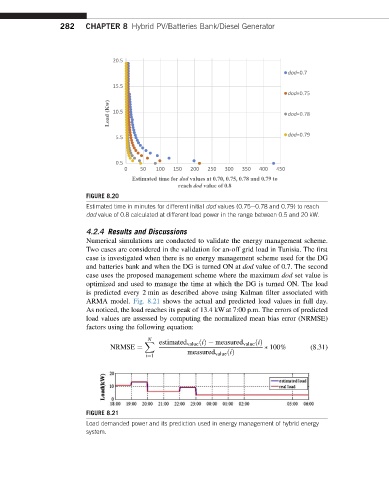
FIGURE 8.20
Estimated time in minutes for different initial dod values (0.75e0.78 and 0.79) to reach
dod value of 0.8 calculated at different load power in the range between 0.5 and 20 kW.
4.2.4 Results and Discussions
Numerical simulations are conducted to validate the energy management scheme.
Two cases are considered in the validation for an-off grid load in Tunisia. The first
case is investigated when there is no energy management scheme used for the DG
and batteries bank and when the DG is turned ON at dod value of 0.7. The second
case uses the proposed management scheme where the maximum dod set value is
optimized and used to manage the time at which the DG is turned ON. The load
is predicted every 2 min as described above using Kalman filter associated with
ARMA model. Fig. 8.21 shows the actual and predicted load values in full day.
As noticed, the load reaches its peak of 13.4 kW at 7:00 p.m. The errors of predicted
load values are assessed by computing the normalized mean bias error (NRMSE)
factors using the following equation:
N
estimated value ðiÞ measured value ðiÞ
X
NRMSE ¼ 100% (8.31)
measured value ðiÞ
i¼1
FIGURE 8.21
Load demanded power and its prediction used in energy management of hybrid energy
system.