
Page 410 -
P. 410
390 CHAPTER 9 PROJECT SCHEDULING: PERT/CPM
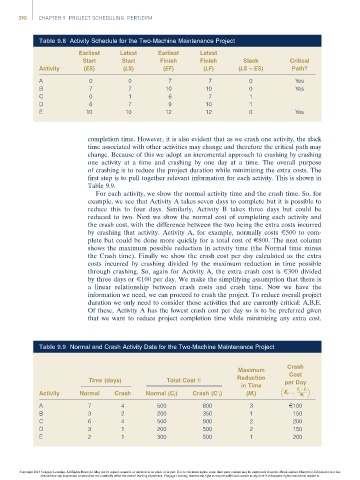
Table 9.8 Activity Schedule for the Two-Machine Maintenance Project
Earliest Latest Earliest Latest
Start Start Finish Finish Slack Critical
Activity (ES) (LS) (EF) (LF) (LS – ES) Path?
A 0 0 7 7 0 Yes
B 7 7 10 10 0 Yes
C 0 1 6 7 1
D 6 7 9 10 1
E 10 10 12 12 0 Yes
completion time. However, it is also evident that as we crash one activity, the slack
time associated with other activities may change and therefore the critical path may
change. Because of this we adopt an incremental approach to crashing by crashing
one activity at a time and crashing by one day at a time. The overall purpose
of crashing is to reduce the project duration while minimizing the extra costs. The
first step is to pull together relevant information for each activity. This is shown in
Table 9.9.
For each activity, we show the normal activity time and the crash time. So, for
example, we see that Activity A takes seven days to complete but it is possible to
reduce this to four days. Similarly, Activity B takes three days but could be
reduced to two. Next we show the normal cost of completing each activity and
thecrashcost,withthedifferencebetweenthetwo beingtheextracosts incurred
by crashing that activity. Activity A, for example, normally costs E500 to com-
pletebut couldbedonemorequickly foratotalcostof E800. The next column
shows the maximum possible reduction in activity time (the Normal time minus
the Crash time). Finally we show the crash cost per day calculated as the extra
costs incurred by crashing divided by the maximum reduction in time possible
through crashing. So, again for Activity A, the extra crash cost is E300 divided
by three days or E100 per day. We make the simplifying assumption that there is
a linear relationship between crash costs and crash time. Now we have the
information we need, we can proceed to crash the project. To reduce overall project
duration we only need to consider those activities that are currently critical: A,B,E.
Of these, Activity A has the lowest crash cost per day so is to be preferred given
that we want to reduce project completion time while minimizing any extra cost.
Table 9.9 Normal and Crash Activity Data for the Two-Machine Maintenance Project
Crash
Maximum
Cost
Reduction
Time (days) Total Cost E per Day
in Time 0
i
0
Activity Normal Crash Normal (C i ) Crash (C i ) (M i ) K i ¼ C C i
M i
A 7 4 500 800 3 E100
B 3 2 200 350 1 150
C 6 4 500 900 2 200
D 3 1 200 500 2 150
E 2 1 300 500 1 200
Copyright 2014 Cengage Learning. All Rights Reserved. May not be copied, scanned, or duplicated, in whole or in part. Due to electronic rights, some third party content may be suppressed from the eBook and/or eChapter(s). Editorial review has
deemed that any suppressed content does not materially affect the overall learning experience. Cengage Learning reserves the right to remove additional content at any time if subsequent rights restrictions require it.