
Page 437 - Applied Numerical Methods Using MATLAB
P. 437
426 PARTIAL DIFFERENTIAL EQUATIONS
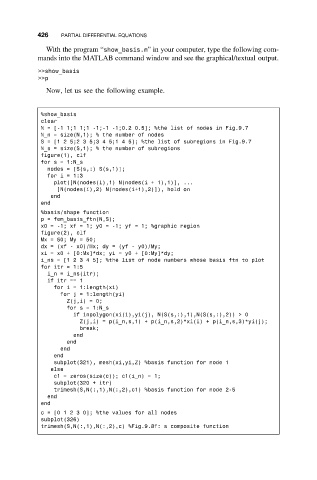
With the program “show_basis.m” in your computer, type the following com-
mands into the MATLAB command window and see the graphical/textual output.
>>show_basis
>>p
Now, let us see the following example.
%show_basis
clear
N = [-1 1;1 1;1 -1;-1 -1;0.2 0.5]; %the list of nodes in Fig.9.7
N_n = size(N,1); % the number of nodes
S = [1 2 5;2 3 5;3 4 5;1 4 5]; %the list of subregions in Fig.9.7
N_s = size(S,1); % the number of subregions
figure(1), clf
for s = 1:N_s
nodes = [S(s,:) S(s,1)];
for i = 1:3
plot([N(nodes(i),1) N(nodes(i + 1),1)], ...
[N(nodes(i),2) N(nodes(i+1),2)]), hold on
end
end
%basis/shape function
p = fem_basis_ftn(N,S);
x0 = -1; xf = 1; y0 = -1; yf = 1; %graphic region
figure(2), clf
Mx = 50; My = 50;
dx = (xf - x0)/Mx; dy = (yf - y0)/My;
xi = x0 + [0:Mx]*dx; yi = y0 + [0:My]*dy;
i_ns=[12345]; %the list of node numbers whose basis ftn to plot
for itr = 1:5
i_n = i_ns(itr);
if itr == 1
for i = 1:length(xi)
for j = 1:length(yi)
Z(j,i) = 0;
for s = 1:N_s
if inpolygon(xi(i),yi(j), N(S(s,:),1),N(S(s,:),2)) > 0
Z(j,i) = p(i_n,s,1) + p(i_n,s,2)*xi(i) + p(i_n,s,3)*yi(j);
break;
end
end
end
end
subplot(321), mesh(xi,yi,Z) %basis function for node 1
else
c1 = zeros(size(c)); c1(i_n) = 1;
subplot(320 + itr)
trimesh(S,N(:,1),N(:,2),c1) %basis function for node 2-5
end
end
c=[01230]; %the values for all nodes
subplot(326)
trimesh(S,N(:,1),N(:,2),c) %Fig.9.8f: a composite function