
Page 190 - Applied Process Design For Chemical And Petrochemical Plants Volume II
P. 190
Distillation 179
may be used for any service including fouling and fluids with gas countercurrent. For dry tray only gas is flowing
containing solids with no loss in efficiency. Holes of %-in. and no liquid, and the pressure drop is a ftmction of the
dia. are often used in vacuum service. orifice coefficient. For wet tray pressure drop, gas and liq-
Holes spaced closer than twice the hole diameter lead uid are both flowing, and the pressure drop is a function
to unstable operation. The recommended spacing is 2.5 of clear liquid head, head over the weir, and hydraulic gra-
do to 5 do with 3.8 do being preferable [42]. Holes are usu- dient, residual pressure drop, foam density and height,
ally placed on 60" equilateral triangular pitch with the liq- aeration and two-phase regime Factors, bubbling frequen-
uid flowing normally to the rows. Holes should not be cy [192]. The pressure drop associated with the down-
greater than 2.5-3 in. apart for effective tray action. comer is a function of liquid backup, foam density and
The percentage hole area in a tray varies according to aeration factor, and liquid throw at the outlet weir [ 1921.
the needs of the design; the usual range is 415% of the See Figure 8-101, which relates similar factors for bubble
total tower cross-section. Experience has indicated that cap trays, as well as valve trays.
[quia rare I ,
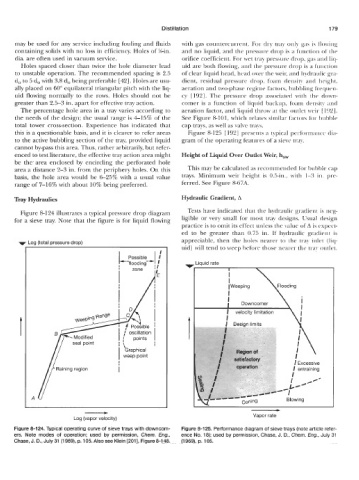
this is a questionable basis, and it is clearer to refer areas Figure 8-125 [ 1921 presents a typical performance clia-
to the active bubbling section of the tray, provided liquid gram of the operating features of' a sieve tray.
cannot by-pass this area. Thus, rather arbitrarily, but refer-
enced to test literature, the effective tray action area might Height of Liquid Over Outlet Weir, how
be the. area enclosed by encircling the perforated hole
area a distance 2-3 in. from the periphery holes. On this This may be calculated as recommended for bubble cap
basis, the hole area would be 625% with a usual value trays. Minimum weir height is 0.5-in., with 1-3 in. pre-
range of 7-16% with about 10% being preferred. ferred. See Figure 8-67A.
Tray Hydraulics Hydraulic Gradient, A
Figure 8-1 24 illustrates a typical pressure drop diagram Tests have indicated that the hydraulic gradient is neg-
for a sieve tray. Note that the figure is for liquid flowing ligible or very small for most tray designs. Usual design
practice is to omit its effect unless the value of A is expect-
ed to be greater than 0.75 in. If hydraulic gradient is
-oa (total Dressure drod appreciable, then the holes nearer to the tray inlet (liq-
uid) will tend to weep before those nearer the tray outlet.
I I1
41 I I I Weeping Flooding I
Downcomer
f Possible I velocity limitation A
oscillation I
; points
seal point \ I
'Graphical
weep point
1 Excessive
Raining region I entraining
I
I (/-
Lc
'I
-
A -
Blowing
Log (vapor velocity) Vapor rate
Figure 8-124. Typical operating curve of sieve trays with downcom- Figure 8-125. Performance diagram of sieve trays (note article refer-
ers. Note modes of operation; used by permission, Chem. Eng., ence No. 18); used by permission, Chase, J. D., Chem. Eng., July 31
Chase, J. D., July31 (1969), p. 105. Also see Klein [201], Figure8-148. (1 969), p. 105.