Page 203 - Applied Process Design For Chemical And Petrochemical Plants Volume II
P. 203

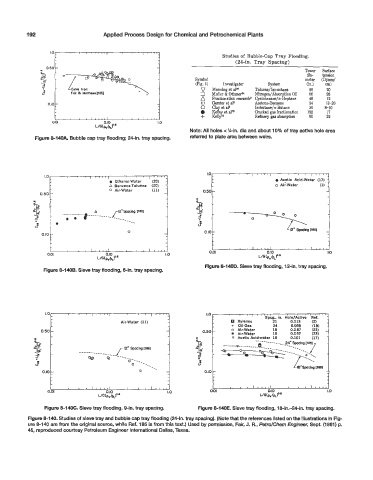
1 92                      Applied Process Design for Chemical and Petrochemical Plants


                  I .o               I    .  .
                                                                           Studies of  Bubble-Cap  Tray Flooding.
                                                                               (24-in.  Tray  Spacing)
                 0.50
                                                                                                      Tower   SUrfaCe
                                                                                                       dia-   tension
                                                                  Symbol                               meter   (Dynes/
                                                                  (Fig. I)   Investigator   System     (in.)   em)
                                                                    D  Manning et aP   Toluene/Iso-octane   60   20
                                                                        Muller & Othmer"   Nitrogen/Absorption Oil   66   26
                                                                    a  Fractionation research*  Cyclohexane/n-Heptane   48   12
                                                                    (I)   Gerater et aI2   Acetone-Benzene   24   13-20
                                                                    0  Clay et a15    Isobutane/n-Butane   36   8-10
                                                                    0   Kelley et all9   Cracked gas fractionation   192   17
                   t           I   I  ,,,I            1             +   Kelly18       Refinery gas absorption   90   22
                  0.01              0.10              1.0
                                 L/G(&,/RP"
                                                                Note: All holes e %-in. dia and about 10% of tray active hole area
             Figure 8-140A. Bubble cap tray flooding; 24-in. tray spacing.   referred to plate area between weirs.


                                                                       1                     o  Air-Water
                                                                                              Acetic  Acid-Water  (17)-
                                                                     0.50


                                           0


                                                                       0.01               0.10                I .o
                                                                                       L/G ( h/kp.8
                                                                     Figure 8-140D. Sieve tray flooding, 12-in. tray spacing.
                Figure 8-1409. Sieve tray flooding, 6-in. tray spacing.


                1.0.            I  '  "'I          I  '  '  '  'I     1.0
                                                                                     I  '  '  'S'p'cg., in.  Hble/A;tive   'Rdf.'  '  -
                                         Air-Water  (11)                        Xylenes     21    0.113   (2)   -
                                                                              +  Oil-Gas    24    0.059   (19)   -
                                                        -                     0  Air-Water   18   0.087   (23)  -
                                                                                                         (23)
                                                                  "   0.50 -   0  AirWater   18   0.057   (17)   -
                                                                              v  Acetic Acid-water  18
                                                                                                  0.101
                                                                                      -----____ ---__ 24" SpaClng ti851
                                                                           ------* --_-________   -_ -=-__ /
                                          12" Spacing 11851               -0-            --__         -.
                                                                        -   -0-0.-
             I
             V                                     -.              0"
               0.10                                                  0.10 -                                  -


                Figure  8-14OC. Sieve tray flooding, 9-in. tray spacing.   Figure  8-140E. Sieve tray flooding, 18-in.-24-in.  tray spacing.
          Figure 8-140. Studies of sieve tray and bubble cap tray flooding (24-in. tray spacing). (Note that the references listed on the illustrations in Fig-
          ure 8-140 are from the original source, while Ref. 185 is from this text.)  Used by permission, Fair, J. R., Petro/Chem €ngineeG Sept.  (1961) p.
          45,  reproduced courtesy Petroleum Engineer International Dallas, Texas.
   198   199   200   201   202   203   204   205   206   207   208