
Page 201 - Applied Process Design For Chemical And Petrochemical Plants Volume II
P. 201
190 Applied Process Design for Chemical and Petrochemical Plants
P
4
a
z
-
0
I-
o
a
K
LL
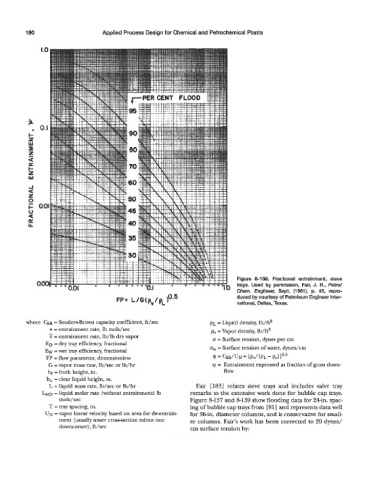
Figure 8-138. Fractional entrainment, sieve
,
trays. Used by permission, Fair, J. R., Petrol
Chem. Engineer, Sept. (1961), p. 45, repro-
duced by courtesy of Petroleum Enginee !r Inter-
national, Dallas, Texas.
where CSB = Souders-Brown capacity coefficient, ft/sec p~ = Liquid density, lb/ft3
e = entrainment rate, lb mols/sec
- pv = Vapor density, lb/ft3
e = entrainment rate, lb/lb dry vapor o = Surface tension, dynes per cm
ED = dry tray efficiency, fractional
EW = wet tray efficiency, fractional ow = Surface tension of water, dynes/cm
-
FP = flow parameter, dimensionless Q = CSB/UN = W(PL p,)I0.'
G = vapor mass rate, lb/sec or lb/hr I/J = Entrainment expressed as fraction of gross down-
hf = froth height, in. flow
hL = clear liquid height, in.
L = liquid mass rate, lb/sec or lb/hr Fair [183] relates sieve trays and includes valve tray
Lb1~ = liquid molar rate (without entrainment) lb remarks to the extensive work done for bubble cap trays.
mols/sec Figure 8-137 and 8-139 show flooding data for 24in. spac-
T = tray spacing, in. ing of bubble cap trays from [81] and represents data well
Ux = vapor linear velocity based on area for de-entrain- for 36in. diameter columns, and is conservative for small-
ment (usually tower cross-section minus one er columns. Fair's work has been corrected to 20 dynes/
downcomer), ft/sec cm surface tension by: