
Page 202 - Applied Process Design For Chemical And Petrochemical Plants Volume II
P. 202
Distillation 191
suggests the following factors to reduce the CSB/CSB,charp
See paragraph 3(a) above.
for similar systems, where $1 = 49. Because the flow para- Figure 8-137 is used for estimating the entrainment-
meter is related to CSB and $, it is affected also: flood point. Liquid particle entrainment is generally con-
sidered as reducing tray efficiency (performance).
(FP)o = 20/(FP) = (~/20)'.* (8 - 293)
Figure 8-138 [183] represents the final entrainment cor-
relation used for estimating, thus, based on published data:
(Fp) = L/G.JPv /PI> (8 - 294)
Figure 8-138 [183] is useful for data correlation, but is
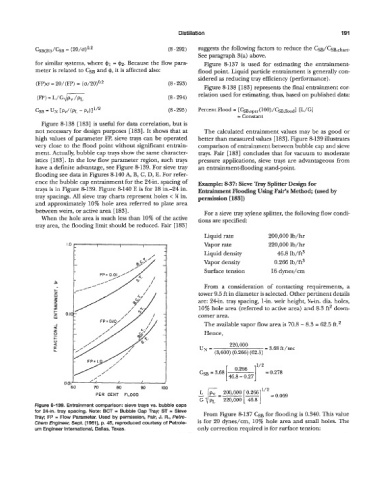
not necessary for design purposes [183]. It shows that at The calculated entrainment values may be as good or
high values of parameter FP, sieve trays can be operated better than measured values [ 1831. Figure 8-139 illustrates
very close to the flood point without significant entrain- comparison of entrainment between bubble cap and sieve
ment. Actually, bubble cap trays show the same character- trays. Fair [183] concludes that for vacuum to moderate
istics [ 1831. In the low flow parameter region, such trays pressure applications, sieve trays are advantageous from
have a definite advantage, see Figure 8-139. For sieve tray an entrainment-flooding stand-point.
flooding see data in Figures 8-140 A, B, C, D, E. For refer-
ence the bubble cap entrainment for the 24in. spacing of Example: 837: Sieve Tray Splitter Design for
trays is in Figure 8-139. Figure 8-140 E is for 18 in.-24 in. Entrainment Flooding Using Fair's Method; (used by
tray spacings. All sieve tray charts represent holes < % in. permission [ 1831)
and approximately 10% hole area referred to plate area
between weirs, or active area [ 1831. For a sieve tray xylene splitter, the following flow condi-
When the hole area is much less than 10% of the active tions are specified:
tray area, the flooding limit should be reduced. Fair [183]
Liquid rate 200,000 lb/hr
1.0 c I I Vapor rate 220,000 lb/hr
Liquid density 46.8 lb/ft3
Vapor density 0.266 lb/ft3
Surface tension 16 dynes/cm
3.
From a consideration of contacting requirements, a
I-
z tower 9.5 ft in diameter is selected. Other pertinent details
W
I are: 24in. tray spacing, 1-in. weir height, %An. dia. holes,
a
a 10% hole area (referred to active area) and 8.3 ft2 down-
I-
2 comer area.
w
-I The available vapor flow area is '70.8 - 8.3 = 62.5 ft.2
a
z
2 Hence,
t-
0
a 220,000
K UN = = 3.68 ft / sec
LL (3,600) (0.266) (62.3)
CSB = 3.68 [ 0.266 1~'~=~.~7~
/, 46.8 - 0.27
0.011 I I I
60 70 80 90 100
FER CENT FLOOD
Figure 8-139. Entrainment comparison: sieve trays vs. bubble caps
for 24-in. tray spacing. Note: BCT = Bubble Cap Tray; ST = Sieve From Figure 8-13'7 CSB for flooding is 0.340. This value
Tray; FP = Flow Parameter. Used by permission, Fair, J. R., Pefro-
Chem Engineer, Sept. (1 961), p. 45, reproduced courtesy of Petrole- is for 20 dynes/cm, 10% hole area and small holes. The
um Engineer International, Dallas, Texas. only correction required is for surface tension: