
Page 205 - Applied Process Design For Chemical And Petrochemical Plants Volume II
P. 205
194 Applied Process Design for Chemical and Petrochemical Plants
g = gravitational constant, m/sec2
d = column diameter, m
p~ = liquid density, kg/m3
-
a = relative froth density, = hL/hf
hL = clear liquid head, m
The interpretation of criterion for the use of B, is that:
1. Full-wave oscillations will not occur for values below
B, = 0.5 x lo-’
2. Half-wave oscillations will not occur for values below
B, = 2.5 x 10⁻⁵
To counter the oscillation effects, Biddulph [87] rec-
L, ,Liquid Flow Rote,gpm.
ommends use of two vertical baffles made of expanded
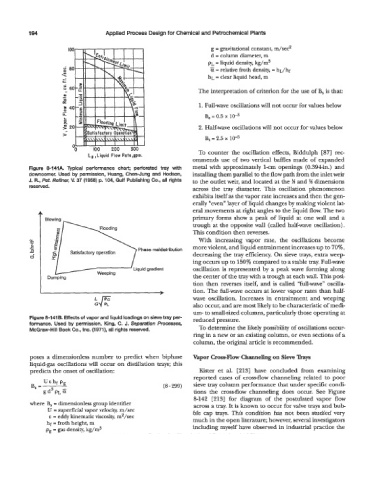
Figure 8-141A. Typical performance chart; perforated tray with metal with approximately lcm openings (0.394in.) and
downcomer. Used by permission, Huang, Chen-Jung and Hodson, installing them parallel to the flow path from the inlet weir
J. R., Pet- Refiner, V. 37 (1958) p. 104, Gulf Publishing Co., all rights to the outlet weir, and located at the Yi and % dimensions
reserved. across the tray diameter. This oscillation phenomenon
exhibits itself as the vapor rate increases and then the gen-
erally “even” layer of liquid changes by making violent lat-
4 eral movements at right angles to the liquid flow. The two
Blowing primary forms show a peak of liquid at one wall and a
trough at the opposite wall (called half-wave oscillation).
This condition then reverses.
z With increasing vapor rate, the oscillations become
N
c E more violent, and liquid entrainment increases up to 70%,
P Phase maldistribution
d decreasing the tray efficiency. On sieve trays, extra weep-
ing occurs up to 150% compared to a stable tray. Full-wave
‘Liquid gradient oscillation is represented by a peak wave forming along
Weeping
Dumping the center of the tray with a trough at each wall. This posi-
tion then reverses itself, and is called “full-wave’’ oscilla-
tion. The full-wave occurs at lower vapor rates than half-
wave oscillation. Increases in entrainment and weeping
also occur, and are most likely to be characteristic of medi-
um- to small-sized columns, particularly those operating at
Figure 8-141B. Effects of vapor and liquid loadings on sieve tray per- reduced pressure.
formance. Used by permission, King, C. J. Separation Processes,
McGraw-Hill Book Co., Inc. (1971), all rights reserved. To determine the likely possibility of oscillations occur-
ring in a new or an existing column, or even sections of a
column, the original article is recommended.
poses a dimensionless number to predict when biphase Vapor Cross-Flow Channeling on Sieve Trays
liquid-gas oscillations will occur on distillation trays; this
predicts the onset of oscillation: Kister et al. [213] have concluded from examining
reported cases of cross-flow channeling related to poor
-
(8 299) sieve tray column performance that under specific condi-
tions the cross-flow channeling does occur. See Figure
8-142 [213] for diagram of the postulated vapor flow
where B, = dimensionless group identifier across a tray. It is known to occur for valve trays and bub-
U = superficial vapor velocity, m/sec ble cap trays. This condition has not been studied very
E = eddy kinematic viscosity, m2/sec
hf = froth height, m much in the open literature; however, several investigators
pg = gas density, kg/m3 including myself have observed in industrial practice the