
Page 271 - Applied statistics and probability for engineers
P. 271
Section 7-3/General Concepts of Point Estimation 249
(d) Find a point estimate for the median proton lux in this
time period.
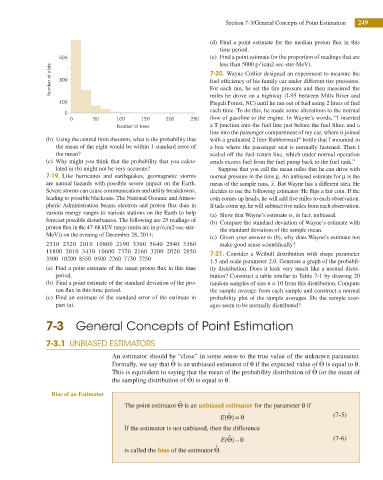
500 (e) Find a point estimate for the proportion of readings that are
less than 5000 p / (cm2-sec-ster-MeV).
Number of plots 300 7-20. Wayne Collier designed an experiment to measure the
fuel eficiency of his family car under different tire pressures.
For each run, he set the tire pressure and then measured the
100 miles he drove on a highway (I-95 between Mills River and
Pisgah Forest, NC) until he ran out of fuel using 2 liters of fuel
each time. To do this, he made some alterations to the normal
0
0 50 100 150 200 250 low of gasoline to the engine. In Wayne’s words, “I inserted
Number of trees a T-junction into the fuel line just before the fuel ilter, and a
line into the passenger compartment of my car, where it joined
(b) Using the central limit theorem, what is the probability that with a graduated 2 liter Rubbermaid bottle that I mounted in
©
the mean of the eight would be within 1 standard error of a box where the passenger seat is normally fastened. Then I
the mean? sealed off the fuel-return line, which under normal operation
(c) Why might you think that the probability that you calcu- sends excess fuel from the fuel pump back to the fuel tank.”
lated in (b) might not be very accurate? Suppose that you call the mean miles that he can drive with
7-19. Like hurricanes and earthquakes, geomagnetic storms normal pressure in the tires μ. An unbiased estimate for μ is the
are natural hazards with possible severe impact on the Earth. mean of the sample runs, x. But Wayne has a different idea. He
Severe storms can cause communication and utility breakdowns, decides to use the following estimator: He lips a fair coin. If the
leading to possible blackouts. The National Oceanic and Atmos- coin comes up heads, he will add ive miles to each observation.
pheric Administration beams electron and proton lux data in If tails come up, he will subtract ive miles from each observation.
various energy ranges to various stations on the Earth to help (a) Show that Wayne’s estimate is, in fact, unbiased.
forecast possible disturbances. The following are 25 readings of (b) Compare the standard deviation of Wayne’s estimate with
proton lux in the 47-68 kEV range (units are in p / (cm2-sec-ster- the standard deviation of the sample mean.
MeV)) on the evening of December 28, 2011:
(c) Given your answer to (b), why does Wayne’s estimate not
2310 2320 2010 10800 2190 3360 5640 2540 3360 make good sense scientiically?
11800 2010 3430 10600 7370 2160 3200 2020 2850 7-21. Consider a Weibull distribution with shape parameter
3500 10200 8550 9500 2260 7730 2250
1.5 and scale parameter 2.0. Generate a graph of the probabil-
(a) Find a point estimate of the mean proton lux in this time ity distribution. Does it look very much like a normal distri-
period. bution? Construct a table similar to Table 7-1 by drawing 20
(b) Find a point estimate of the standard deviation of the pro- random samples of size n = 10 from this distribution. Compute
ton lux in this time period. the sample average from each sample and construct a normal
(c) Find an estimate of the standard error of the estimate in probability plot of the sample averages. Do the sample aver-
part (a). ages seem to be normally distributed?
7-3 General Concepts of Point Estimation
7-3.1 UNBIASED ESTIMATORS
An estimator should be “close” in some sense to the true value of the unknown parameter.
ˆ
ˆ
Formally, we say that Θ is an unbiased estimator of θ if the expected value of Θ is equal to θ.
ˆ
This is equivalent to saying that the mean of the probability distribution of Θ (or the mean of
ˆ
the sampling distribution of Θ) is equal to θ.
Bias of an Estimator
ˆ
The point estimator Θ is an unbiased estimator for the parameter θ if
ˆ
E( ) = θ (7-5)
Θ
If the estimator is not unbiased, then the difference
ˆ
E( )Θ − θ (7-6)
ˆ
is called the bias of the estimator Θ.