Page 125 - Applied Statistics Using SPSS, STATISTICA, MATLAB and R
P. 125

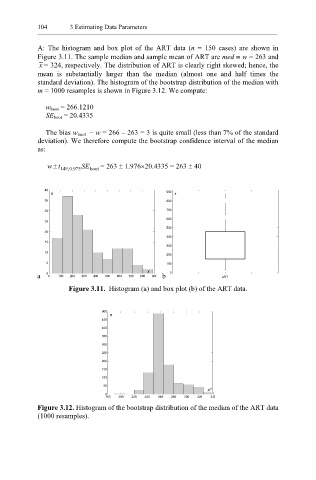
104      3 Estimating Data Parameters


           A: The  histogram and box  plot of the  ART data (n = 150 cases) are shown in
           Figure 3.11. The sample median and sample mean of ART are med ≡ w = 263 and
            x = 324, respectively. The distribution of ART is clearly right skewed; hence, the
           mean is substantially  larger than the  median (almost  one and half times the
           standard deviation). The histogram of the bootstrap distribution of the median with
           m = 1000 resamples is shown in Figure 3.12. We compute:

              w boot = 266.1210
              SE boot = 20.4335

              The bias w boot   − w = 266 – 263 = 3 is quite small (less than 7% of the standard
           deviation). We therefore compute the bootstrap confidence interval of the median
           as:

              w  t ±  149  . 0 ,  975 SE boot  = 263 ± 1.976×20.4335 = 263 ± 40


             40
               n                               900  x
             35                                800
             30                                700
                                               600
             25
                                               500
             20
                                               400
             15
                                               300
             10
                                               200
              5                                100
                                          x     0
           a   0 0  100  200  300  400  500  600  700  800  900 b  ART
                    Figure 3.11.  Histogram (a) and box plot (b) of the ART data.


                             500
                                n
                             450
                             400
                             350
                             300
                             250
                             200
                             150
                             100
                              50
                                                           x*
                              0
                              180  200  220  240  260  280  300  320  340
           Figure 3.12. Histogram of the bootstrap distribution of the median of the ART data
           (1000 resamples).
   120   121   122   123   124   125   126   127   128   129   130