
Page 120 - Applied Statistics Using SPSS, STATISTICA, MATLAB and R
P. 120
3.6 Bootstrap Estimation 99
i. F df 2 ,df 1 , 1 − α = / 1 F df , 1 df 2 α , . For instance, if in Example 3.8 we wished to
compute a 95% one-sided confidence interval, [0, r], for σ 2/σ 1, we would
then have to compute F 578 , 383 . 0 , 05 = / F 383 , 578 . 0 , 95 = 0.859.
1
2
ii. F df ,∞ ,α = χ df ,α / df . Note that, in formula 3.21, with n 2 → ∞ the sample
2
variance v 2 converges to the true variance, s 2 , yielding, therefore, the
single-variance situation described by the chi-square distribution. In this
sense the chi-square distribution can be viewed as a limiting case of the F
distribution.
Commands 3.6. MATLAB and R commands for obtaining confidence intervals of
a variance ratio.
MATLAB civar2(v1,n1,v2,n2,alpha)
R civar2(v1,n1,v2,n2,alpha)
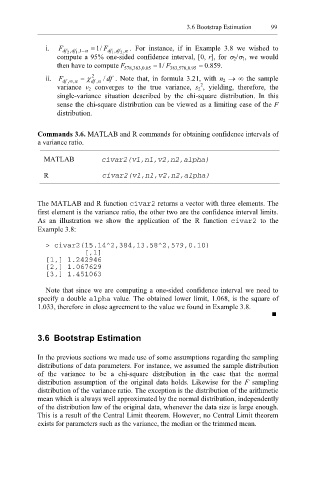
The MATLAB and R function civar2 returns a vector with three elements. The
first element is the variance ratio, the other two are the confidence interval limits.
As an illustration we show the application of the R function civar2 to the
Example 3.8:
> civar2(15.14^2,384,13.58^2,579,0.10)
[,1]
[1,] 1.242946
[2,] 1.067629
[3,] 1.451063
Note that since we are computing a one-sided confidence interval we need to
specify a double alpha value. The obtained lower limit, 1.068, is the square of
1.033, therefore in close agreement to the value we found in Example 3.8.
3.6 Bootstrap Estimation
In the previous sections we made use of some assumptions regarding the sampling
distributions of data parameters. For instance, we assumed the sample distribution
of the variance to be a chi-square distribution in the case that the normal
distribution assumption of the original data holds. Likewise for the F sampling
distribution of the variance ratio. The exception is the distribution of the arithmetic
mean which is always well approximated by the normal distribution, independently
of the distribution law of the original data, whenever the data size is large enough.
This is a result of the Central Limit theorem. However, no Central Limit theorem
exists for parameters such as the variance, the median or the trimmed mean.