
Page 207 - Applied Statistics Using SPSS, STATISTICA, MATLAB and R
P. 207
188 5 Non-Parametric Tests of Hypotheses
The coefficients a i in formula 5.17 and the critical values of the sampling
distribution of W, for several confidence levels, can be obtained from table look-up
(see e.g. Conover, 1980).
The Shapiro-Wilk test is considered a better test than the previous ones,
especially when the sample size is small. It is available in SPSS and STATISTICA
as a complement of histograms and normality plots, respectively (see Commands
5.5). It is also available in R as the function shapiro.test(x) . When applied
to Example 5.8, it produces an observed significance of p = 0.88. With this high
significance, it is safe to accept the null hypothesis.
Table 5.9 illustrates the behaviour of the goodness of fit tests in an experiment
using small to moderate sample sizes (n = 10, 25 and 50), generated according to a
known law. The lognormal distribution corresponds to a random variable whose
“
”
logarithm is normally distributed. The Bimodal samples were generated using the
sum of two Gaussian functions separated by 4σ. For each value of n a large
number of samples were generated (see top of Table 5.9), and the percentage of
correct decisions at a 5% level of significance was computed.
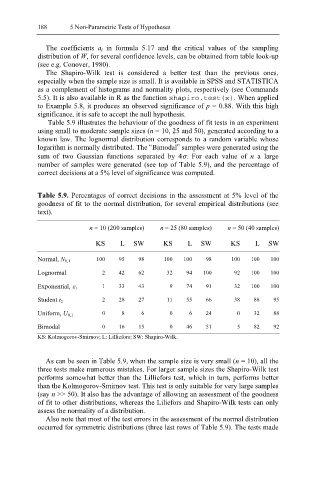
Table 5.9. Percentages of correct decisions in the assessment at 5% level of the
goodness of fit to the normal distribution, for several empirical distributions (see
text).
n = 10 (200 samples) n = 25 (80 samples) n = 50 (40 samples)
KS L SW KS L SW KS L SW
Normal, N 0,1 100 95 98 100 100 98 100 100 100
Lognormal 2 42 62 32 94 100 92 100 100
Exponential, ε 1 1 33 43 9 74 91 32 100 100
Student t 2 2 28 27 11 55 66 38 88 95
Uniform, U 0,1 0 8 6 0 6 24 0 32 88
Bimodal 0 16 15 0 46 51 5 82 92
KS: Kolmogorov-Smirnov; L: Lilliefors; SW: Shapiro-Wilk.
As can be seen in Table 5.9, when the sample size is very small (n = 10), all the
three tests make numerous mistakes. For larger sample sizes the Shapiro-Wilk test
performs somewhat better than the Lilliefors test, which in turn, performs better
than the Kolmogorov-Smirnov test. This test is only suitable for very large samples
(say n >> 50). It also has the advantage of allowing an assessment of the goodness
of fit to other distributions, whereas the Liliefors and Shapiro-Wilk tests can only
assess the normality of a distribution.
Also note that most of the test errors in the assessment of the normal distribution
occurred for symmetric distributions (three last rows of Table 5.9). The tests made