
Page 76 - Applied Statistics Using SPSS, STATISTICA, MATLAB and R
P. 76
2.2 Presenting the Data 55
The s , c arguments of MATLAB scatt er and scat ter3 are the size and
colour of the marks, respectively.
The plot.d efault function is the x-y scatter plot function of R and has
several configuration parameters available (colours, type of marks, etc.). The R
Graphics package has no 3D plot available.
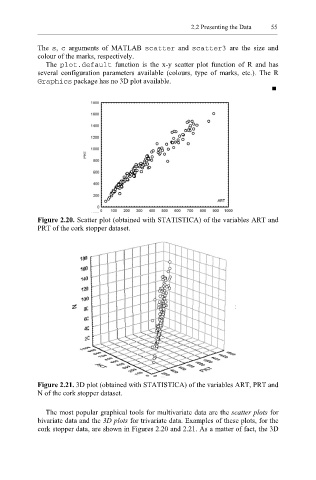
Figure 2.20. Scatter plot (obtained with STATISTICA) of the variables ART and
PRT of the cork stopper dataset.
Figure 2.21. 3D plot (obtained with STATISTICA) of the variables ART, PRT and
N of the cork stopper dataset.
The most popular graphical tools for multivariate data are the scatter plots for
bivariate data and the 3D plots for trivariate data. Examples of these plots, for the
cork stopper data, are shown in Figures 2.20 and 2.21. As a matter of fact, the 3D