
Page 75 - Applied Statistics Using SPSS, STATISTICA, MATLAB and R
P. 75
54 2 Presenting and Summarising the Data
Example 2.4
Q: Determine the trivariate table for the variables SEX, LIKE and DISPL of the
Freshmen dataset.
A: In order to represent cross tables for more than two variables, one builds sub-
tables for each value of one of the variables in excess of 2, as illustrated in Table
2.5.
Commands 2.4. SPSS, STATISTICA, MATLAB and R commands used to obtain
cross tables.
SPSS Analyze; Descriptive Statistics; Crosstabs
Statistics; Basic Statistics and Tables;
STATISTICA Descriptive Statistics; (Tables and
banners | Multiple Response Tables)
MATLAB crosstab(x,y)
R table(x,y) | xtabs(~x+y)
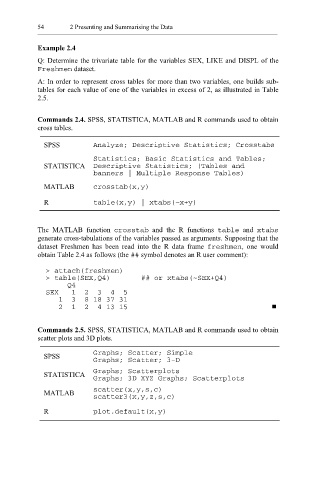
The MATLAB function c rosstab and the R functions table and xtabs
generate cross-tabulations of the variables passed as arguments. Supposing that the
dataset Freshmen has been read into the R data frame freshmen , one would
obtain Table 2.4 as follows (the ## symbol denotes an R user comment):
> attach(freshmen)
> table(SEX,Q4) ## or xtabs(~SEX+Q4)
Q4
SEX 1 2 3 4 5
1 3 8 18 37 31
2 1 2 4 13 15
Commands 2.5. SPSS, STATISTICA, MATLAB and R commands used to obtain
scatter plots and 3D plots.
SPSS Graphs; Scatter; Simple
Graphs; Scatter; 3-D
STATISTICA Graphs; Scatterplots
Graphs; 3D XYZ Graphs; Scatterplots
MATLAB scatter(x,y,s,c)
scatter3(x,y,z,s,c)
R plot.default(x,y)