
Page 72 - Applied Statistics Using SPSS, STATISTICA, MATLAB and R
P. 72
2.2 Presenting the Data 51
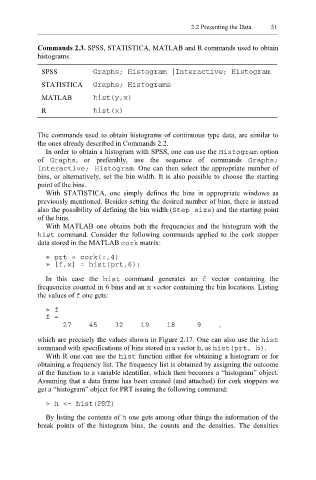
Commands 2.3. SPSS, STATISTICA, MATLAB and R commands used to obtain
histograms.
SPSS Graphs; Histogram |Interactive; Histogram
STATISTICA Graphs; Histograms
MATLAB hist(y,x)
R hist(x)
The commands used to obtain histograms of continuous type data, are similar to
the ones already described in Commands 2.2.
In order to obtain a histogram with SPSS, one can use the Histogram option
of Graphs , or preferably, use the sequence of commands Graphs;
Interactive; Histogram . One can then select the appropriate number of
bins, or alternatively, set the bin width. It is also possible to choose the starting
point of the bins.
With STATISTICA, one simply defines the bins in appropriate windows as
previously mentioned. Besides setting the desired number of bins, there is instead
also the possibility of defining the bin width (Step siz e ) and the starting point
of the bins.
With MATLAB one obtains both the frequencies and the histogram with the
hist command. Consider the following commands applied to the cork stopper
data stored in the MATLAB cork matrix:
» prt = cork(:,4)
» [f,x] = hist(prt,6);
In this case the hist command generates an f vector containing the
frequencies counted in 6 bins and an x vector containing the bin locations. Listing
the values of f one gets:
» f
f =
27 45 32 19 18 9 ,
which are precisely the values shown in Figure 2.17. One can also use the hist
command with specifications of bins stored in a vector , as hist(prt, b) .
b
With R one can use the his t function either for obtaining a histogram or for
obtaining a frequency list. The frequency list is obtained by assigning the outcome
of the function to a variable identifier, which then becomes a “histogram” object.
Assuming that a data frame has been created (and attached) for cork stoppers we
get a “histogram” object for PRT issuing the following command:
> h <- hist(PRT)
By listing the contents of h one gets among other things the information of the
break points of the histogram bins, the counts and the densities. The densities