
Page 67 - Applied Statistics Using SPSS, STATISTICA, MATLAB and R
P. 67
46 2 Presenting and Summarising the Data
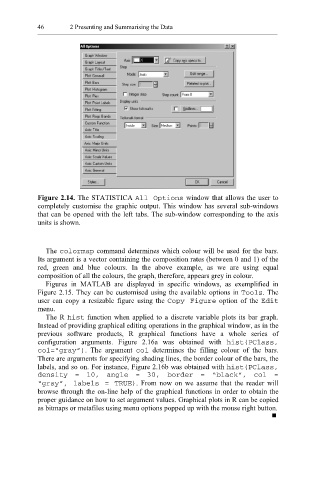
Figure 2.14. The STATISTICA All Op tions window that allows the user to
completely customise the graphic output. This window has several sub-windows
that can be opened with the left tabs. The sub-window corresponding to the axis
units is shown.
The colorma p command determines which colour will be used for the bars.
Its argument is a vector containing the composition rates (between 0 and 1) of the
red, green and blue colours. In the above example, as we are using equal
composition of all the colours, the graph, therefore, appears grey in colour.
Figures in MATLAB are displayed in specific windows, as exemplified in
Figure 2.15. They can be customised using the available options in To ols . The
user can copy a resizable figure using the Copy Figure option of the Edit
menu.
The R hist function when applied to a discrete variable plots its bar graph.
Instead of providing graphical editing operations in the graphical window, as in the
previous software products, R graphical functions have a whole series of
configuration arguments. Figure 2.16a was obtained with hist(P Class,
col=“gray”). The argument col determines the filling colour of the bars.
There are arguments for specifying shading lines, the border colour of the bars, the
labels, and so on. For instance, Figure 2.16b was obtained with hist(PClass,
density = 10, angle = 30, border = “black”, col =
“gray”, labels = TRUE). From now on we assume that the reader will
browse through the on-line help of the graphical functions in order to obtain the
proper guidance on how to set argument values. Graphical plots in R can be copied
as bitmaps or metafiles using menu options popped up with the mouse right button.