
Page 62 - Applied Statistics Using SPSS, STATISTICA, MATLAB and R
P. 62
2.2 Presenting the Data 41
In Table 2.1 the counts are shown in the column headed by Frequency , and
the frequencies, given in percentage, are in the column headed by Percent .
These last ones are unbiased and consistent point estimates of the corresponding
probability values p k. For more details see A.1 and the Appendix C.
Commands 2.1. SPSS, STATISTICA, MATLAB and R commands used to obtain
frequency tables. For SPSS and STATISTICA the semicolon separates menu
options that must be used in sequence.
SPSS Analyze; Descriptive Statistics;
Frequencies
STATISTICA Statistics; Basic Statistics and Tables;
Descriptive Statistics; Frequency Tables
MATLAB tabulate(x)
R table(x); prop.table(x)
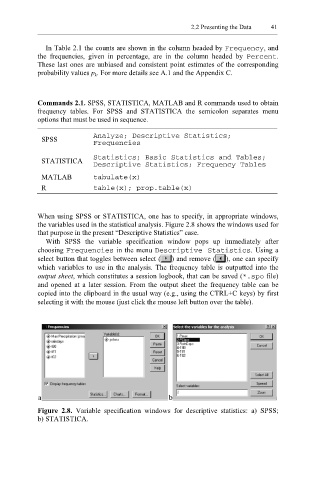
When using SPSS or STATISTICA, one has to specify, in appropriate windows,
the variables used in the statistical analysis. Figure 2.8 shows the windows used for
that purpose in the present “Descriptive Statistics” case.
With SPSS the variable specification window pops up immediately after
choosing Fre quencies in the menu Descriptive Statistics . Using a
select button that toggles between select ( ) and remove ( ), one can specify
which variables to use in the analysis. The frequency table is outputted into the
output sheet, which constitutes a session logbook, that can be saved ( * .spo file)
and opened at a later session. From the output sheet the frequency table can be
copied into the clipboard in the usual way (e.g., using the CTRL+C keys) by first
selecting it with the mouse (just click the mouse left button over the table).
Figure 2.8. Variable specification windows for descriptive statistics: a) SPSS;
b) STATISTICA.