
Page 71 - Applied Statistics Using SPSS, STATISTICA, MATLAB and R
P. 71
50 2 Presenting and Summarising the Data
The choice of an optimal value for r was studied by Scott (Scott DW, 1979),
using as optimality criterion the minimisation of the global mean square error:
ˆ
(
MSE = ∫ D Ε f ( x) − f ( x)) 2 ] dx ,
[
X
X
where D is the domain of the random variable.
The MSE minimisation leads to a formula for the optimal choice of a bin width,
h(n), which for the Gaussian density case is:
h(n) = 3.49sn −1/3 , 2.3
where s is the sample standard deviation of the data.
Although the h(n) formula was derived for the Gaussian density case, it was
experimentally verified to work well for other densities too. With this h(n) one can
compute the optimal number of bins using the data range:
r = (x h − x l)/ h(n). 2.4
80 12
70
10
60
8
50
No of obs 40 No of obs 6
30 4
20
2
10
PRT 0
0 104.00 345.28 586.56 827.84 1069.12 1310.40 1551.68
a 104.000000 606.666667 1109.333333 1612.000000 b 224.64 465.92 707.20 948.48 1189.76 1431.04 PRT
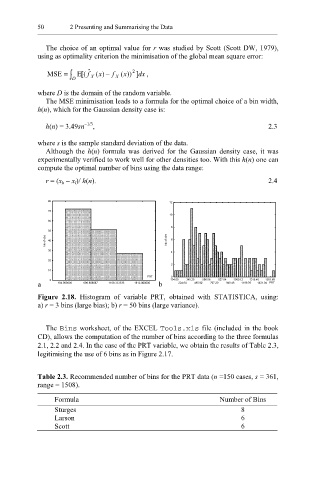
Figure 2.18. Histogram of variable PRT, obtained with STATISTICA, using:
a) r = 3 bins (large bias); b) r = 50 bins (large variance).
The Bins worksheet, of the EXCEL Too ls.xls file (included in the book
CD), allows the computation of the number of bins according to the three formulas
2.1, 2.2 and 2.4. In the case of the PRT variable, we obtain the results of Table 2.3,
legitimising the use of 6 bins as in Figure 2.17.
Table 2.3. Recommended number of bins for the PRT data (n =150 cases, s = 361,
range = 1508).
Formula Number of Bins
Sturges 8
Larson 6
Scott 6