
Page 74 - Applied Statistics Using SPSS, STATISTICA, MATLAB and R
P. 74
2.2 Presenting the Data 53
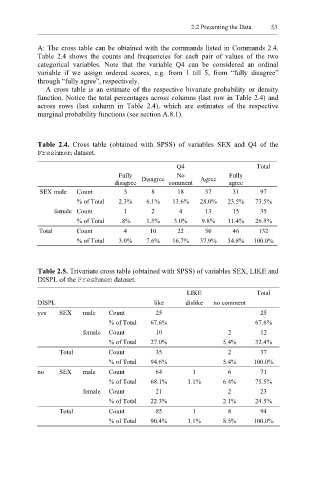
A: The cross table can be obtained with the commands listed in Commands 2.4.
Table 2.4 shows the counts and frequencies for each pair of values of the two
categorical variables. Note that the variable Q4 can be considered an ordinal
variable if we assign ordered scores, e.g. from 1 till 5, from “fully disagree”
through “fully agree”, respectively.
A cross table is an estimate of the respective bivariate probability or density
function. Notice the total percentages across columns (last row in Table 2.4) and
across rows (last column in Table 2.4), which are estimates of the respective
marginal probability functions (see section A.8.1).
Table 2.4. Cross table (obtained with SPSS) of variables SEX and Q4 of the
Freshmen dataset.
Q4 Total
Fully Disagree No Agree Fully
disagree comment agree
SEX male Count 3 8 18 37 31 97
% of Total 2.3% 6.1% 13.6% 28.0% 23.5% 73.5%
female Count 1 2 4 13 15 35
% of Total .8% 1.5% 3.0% 9.8% 11.4% 26.5%
Total Count 4 10 22 50 46 132
% of Total 3.0% 7.6% 16.7% 37.9% 34.8% 100.0%
Table 2.5. Trivariate cross table (obtained with SPSS) of variables SEX, LIKE and
DISPL of the Freshmen dataset.
LIKE Total
DISPL like dislike no comment
yes SEX male Count 25 25
% of Total 67.6% 67.6%
female Count 10 2 12
% of Total 27.0% 5.4% 32.4%
Total Count 35 2 37
% of Total 94.6% 5.4% 100.0%
no SEX male Count 64 1 6 71
% of Total 68.1% 1.1% 6.4% 75.5%
female Count 21 2 23
% of Total 22.3% 2.1% 24.5%
Total Count 85 1 8 94
% of Total 90.4% 1.1% 8.5% 100.0%