
Page 344 - Automotive Engineering Powertrain Chassis System and Vehicle Body
P. 344
Tyre characteristics and vehicle handling and stability C HAPTER 11.1
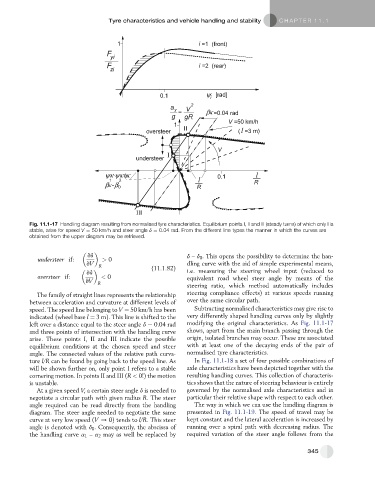
Fig. 11.1-17 Handling diagram resulting from normalised tyre characteristics. Equilibrium points I, II and III (steady turns) of which only I is
stable, arise for speed V ¼ 50 km/h and steer angle d ¼ 0.04 rad. From the different line types the manner in which the curves are
obtained from the upper diagram may be retrieved.
vd d – d 0 . This opens the possibility to determine the han-
understeer if: > 0
vV dling curve with the aid of simple experimental means,
R (11.1.82)
vd i.e. measuring the steering wheel input (reduced to
oversteer if: < 0 equivalent road wheel steer angle by means of the
vV R
steering ratio, which method automatically includes
The family of straight lines represents the relationship steering compliance effects) at various speeds running
between acceleration and curvature at different levels of over the same circular path.
speed. The speed line belonging to V ¼ 50 km/h has been Subtracting normalised characteristics may give rise to
indicated (wheel base l ¼ 3 m). This line is shifted to the very differently shaped handling curves only by slightly
left over a distance equal to the steer angle d ¼ 0.04 rad modifying the original characteristics. As Fig. 11.1-17
and three points of intersection with the handling curve shows, apart from the main branch passing through the
arise. These points I, II and III indicate the possible origin, isolated branches may occur. These are associated
equilibrium conditions at the chosen speed and steer with at least one of the decaying ends of the pair of
angle. The connected values of the relative path curva- normalised tyre characteristics.
ture l/R can be found by going back to the speed line. As In Fig. 11.1-18 a set of four possible combinations of
will be shown further on, only point I refers to a stable axle characteristics have been depicted together with the
cornering motion. In points II and III (R < 0!) the motion resulting handling curves. This collection of characteris-
is unstable. tics shows that the nature of steering behaviour is entirely
At a given speed V, a certain steer angle d is needed to governed by the normalised axle characteristics and in
negotiate a circular path with given radius R. The steer particular their relative shape with respect to each other.
angle required can be read directly from the handling The way in which we can use the handling diagram is
diagram. The steer angle needed to negotiate the same presented in Fig. 11.1-19. The speed of travel may be
curve at very low speed (V / 0) tends to l/R. This steer kept constant and the lateral acceleration is increased by
angle is denoted with d 0 . Consequently, the abscissa of running over a spiral path with decreasing radius. The
the handling curve a 1 – a 2 may as well be replaced by required variation of the steer angle follows from the
345