
Page 405 - Automotive Engineering Powertrain Chassis System and Vehicle Body
P. 405
CHAP TER 1 3. 1 Vehicle motion control
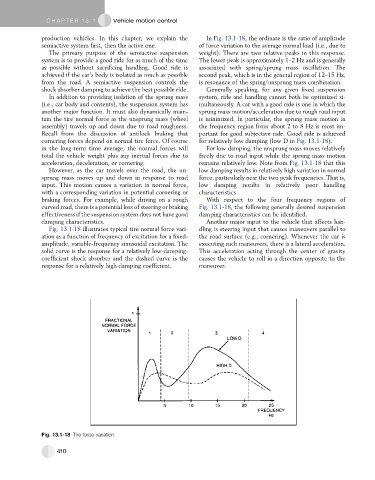
production vehicles. In this chapter, we explain the In Fig. 13.1-18, the ordinate is the ratio of amplitude
semiactive system first, then the active one. of force variation to the average normal load (i.e., due to
The primary purpose of the semiactive suspension weight). There are two relative peaks in this response.
system is to provide a good ride for as much of the time The lower peak is approximately 1–2 Hz and is generally
as possible without sacrificing handling. Good ride is associated with spring/sprung mass oscillation. The
achieved if the car’s body is isolated as much as possible second peak, which is in the general region of 12–15 Hz,
from the road. A semiactive suspension controls the is resonance of the spring/unsprung mass combination.
shock absorber damping to achieve the best possible ride. Generally speaking, for any given fixed suspension
In addition to providing isolation of the sprung mass system, ride and handling cannot both be optimized si-
(i.e., car body and contents), the suspension system has multaneously. A car with a good ride is one in which the
another major function. It must also dynamically main- sprung mass motion/acceleration due to rough road input
tain the tire normal force as the unsprung mass (wheel is minimized. In particular, the sprung mass motion in
assembly) travels up and down due to road roughness. the frequency region from about 2 to 8 Hz is most im-
Recall from the discussion of antilock braking that portant for good subjective ride. Good ride is achieved
cornering forces depend on normal tire force. Of course for relatively low damping (low D in Fig. 13.1-18).
in the long-term time average, the normal forces will For low damping, the unsprung mass moves relatively
total the vehicle weight plus any inertial forces due to freely due to road input while the sprung mass motion
acceleration, deceleration, or cornering. remains relatively low. Note from Fig. 13.1-18 that this
However, as the car travels over the road, the un- low damping results in relatively high variation in normal
sprung mass moves up and down in response to road force, particularly near the two peak frequencies. That is,
input. This motion causes a variation in normal force, low damping results in relatively poor handling
with a corresponding variation in potential cornering or characteristics.
braking forces. For example, while driving on a rough With respect to the four frequency regions of
curved road, there is a potential loss of steering or braking Fig. 13.1-18, the following generally desired suspension
effectiveness if the suspension system does not have good damping characteristics can be identified.
damping characteristics. Another major input to the vehicle that affects han-
Fig. 13.1-18 illustrates typical tire normal force vari- dling is steering input that causes maneuvers parallel to
ation as a function of frequency of excitation for a fixed- the road surface (e.g., cornering). Whenever the car is
amplitude, variable-frequency sinusoidal excitation. The executing such maneuvers, there is a lateral acceleration.
solid curve is the response for a relatively low-damping- This acceleration acting through the center of gravity
coefficient shock absorber and the dashed curve is the causes the vehicle to roll in a direction opposite to the
response for a relatively high damping coefficient. maneuver.
Fig. 13.1-18 Tire force variation.
410