
Page 600 - Automotive Engineering Powertrain Chassis System and Vehicle Body
P. 600
Design and material utilization C HAPTER 18.1
Stress range
Stress amplitude
Strain amplitude
Mean stress 10 –2
Max’m/Min’m stress –3
(a) 10
Reversale to failure (2NF)
10 –4
10 0 10 1 10 2 10 3 10 4 10 5 10 6 10 7 (c) 10 8
Max’m stress Ferrous 1000.
Non-ferrous
800.
10 6 10 8
(b) No. of cycles 600.
Total stress (MPa)
R o = σ u /n 400.
Gerber’s law
R
Menetenic
200.
Goodman’s Cyclic
law
Total strain
0.
(e) M σ u 0.0000 .0040 .0080 .0120 .0160 .0200
(d)
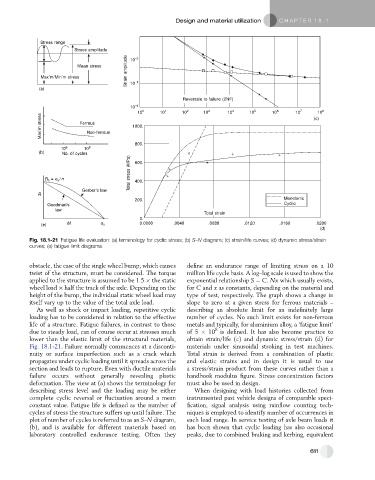
Fig. 18.1-21 Fatigue life evaluation: (a) terminology for cyclic stress; (b) S–N diagram; (c) strain/life curves; (d) dynamic stress/strain
curves; (e) fatigue limit diagrams.
obstacle, the case of the single wheel bump, which causes define an endurance range of limiting stress on a 10
twist of the structure, must be considered. The torque million life cycle basis. A log–log scale is used to show the
applied to the structure is assumed to be 1.5 the static exponential relationship S ¼ C. Nx which usually exists,
wheel load half the track of the axle. Depending on the for C and x as constants, depending on the material and
height of the bump, the individual static wheel load may type of test, respectively. The graph shows a change in
itself vary up to the value of the total axle load. slope to zero at a given stress for ferrous materials –
As well as shock or impact loading, repetitive cyclic describing an absolute limit for an indefinitely large
loading has to be considered in relation to the effective number of cycles. No such limit exists for non-ferrous
life of a structure. Fatigue failures, in contrast to those metals and typically, for aluminium alloy, a ‘fatigue limit’
8
due to steady load, can of course occur at stresses much of 5 10 is defined. It has also become practice to
lower than the elastic limit of the structural materials, obtain strain/life (c) and dynamic stress/strain (d) for
Fig. 18.1-21. Failure normally commences at a disconti- materials under sinusoidal stroking in test machines.
nuity or surface imperfection such as a crack which Total strain is derived from a combination of plastic
propagates under cyclic loading until it spreads across the and elastic strains and in design it is usual to use
section and leads to rupture. Even with ductile materials a stress/strain product from these curves rather than a
failure occurs without generally revealing plastic handbook modulus figure. Stress concentration factors
deformation. The view at (a) shows the terminology for must also be used in design.
describing stress level and the loading may be either When designing with load histories collected from
complete cyclic reversal or fluctuation around a mean instrumented past vehicle designs of comparable speci-
constant value. Fatigue life is defined as the number of fication, signal analysis using rainflow counting tech-
cycles of stress the structure suffers up until failure. The niques is employed to identify number of occurrences in
plot of number of cycles is referred to as an S–N diagram, each load range. In service testing of axle beam loads it
(b), and is available for different materials based on has been shown that cyclic loading has also occasional
laboratory controlled endurance testing. Often they peaks, due to combined braking and kerbing, equivalent
611