
Page 637 - Automotive Engineering Powertrain Chassis System and Vehicle Body
P. 637
Materials for consideration and use in automotive body structures C HAPTER 18.2
of a steel in the annealed condition takes place on only 18.2.2.2.2 Surface topography
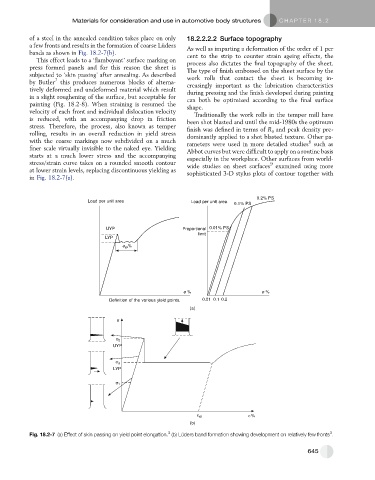
a few fronts and results in the formation of coarse Lu ¨ders As well as imparting a deformation of the order of 1 per
bands as shown in Fig. 18.2-7(b). cent to the strip to counter strain ageing effects, the
This effect leads to a ‘flamboyant’ surface marking on process also dictates the final topography of the sheet.
press formed panels and for this reason the sheet is
The type of finish embossed on the sheet surface by the
subjected to ‘skin passing’ after annealing. As described work rolls that contact the sheet is becoming in-
7
by Butler this produces numerous blocks of alterna- creasingly important as the lubrication characteristics
tively deformed and undeformed material which result during pressing and the finish developed during painting
in a slight roughening of the surface, but acceptable for can both be optimized according to the final surface
painting (Fig. 18.2-8). When straining is resumed the shape.
velocity of each front and individual dislocation velocity Traditionally the work rolls in the temper mill have
is reduced, with an accompanying drop in friction been shot blasted and until the mid-1980s the optimum
stress. Therefore, the process, also known as temper finish was defined in terms of R a and peak density pre-
rolling, results in an overall reduction in yield stress dominantly applied to a shot blasted texture. Other pa-
with the coarse markings now subdivided on a much rameters were used in more detailed studies such as
8
finer scale virtually invisible to the naked eye. Yielding Abbot curves but were difficult to apply on a routine basis
starts at a much lower stress and the accompanying especially in the workplace. Other surfaces from world-
stress/strain curve takes on a rounded smooth contour wide studies on sheet surfaces examined using more
9
at lower strain levels, replacing discontinuous yielding as sophisticated 3-D stylus plots of contour together with
in Fig. 18.2-7(a).
0.2% PS
Load per unit area Load per unit area
0.1% PS
UYP Proportional 0.01% PS
limit
LYP
e yp %
e % e %
Definition of the various yield points. 0.01 0.1 0.2
(a)
σ
σ 2
UYP
σ 3
LYP
σ 1
ε %
ε yp
(b)
3
3
Fig. 18.2-7 (a) Effect of skin passing on yield point elongation. (b) Lu ¨ ders band formation showing development on relatively few fronts .
645