
Page 335 - Biodegradable Polyesters
P. 335
12.6 Properties of PLA/PGA Polymer–Polymer Nanofibrillar Composites 313
(a) (b)
PLLA.PGA.30 PLLA.PGA.20
10 μm 10 μm
(c) (d)
PLLA.PGA.MFC.320 10 μm PLLA.PGA.MFC.20 10 μm
(e) (f)
311 nm
525 nm
PLLA.PGA.MFC.30 – extracted fibrils PLLA.PGA.MFC.30 – extracted fibrils
20 μm 5 μm
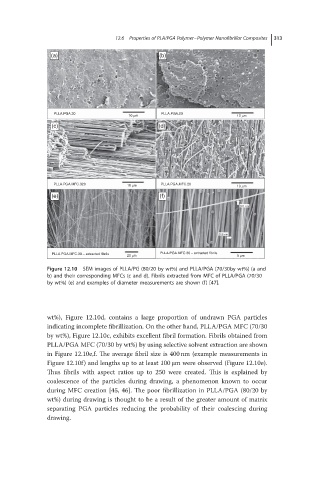
Figure 12.10 SEM images of PLLA/PG (80/20 by wt%) and PLLA/PGA (70/30by wt%) (a and
b) and their corresponding MFCs (c and d). Fibrils extracted from MFC of PLLA/PGA (70/30
by wt%) (e) and examples of diameter measurements are shown (f) [47].
wt%), Figure 12.10d, contains a large proportion of undrawn PGA particles
indicating incomplete fibrillization. On the other hand, PLLA/PGA MFC (70/30
by wt%), Figure 12.10c, exhibits excellent fibril formation. Fibrils obtained from
PLLA/PGA MFC (70/30 by wt%) by using selective solvent extraction are shown
in Figure 12.10e,f. The average fibril size is 400 nm (example measurements in
Figure 12.10f) and lengths up to at least 100 μm were observed (Figure 12.10e).
Thus fibrils with aspect ratios up to 250 were created. This is explained by
coalescence of the particles during drawing, a phenomenon known to occur
during MFC creation [45, 46]. The poor fibrillization in PLLA/PGA (80/20 by
wt%) during drawing is thought to be a result of the greater amount of matrix
separating PGA particles reducing the probability of their coalescing during
drawing.