
Page 197 - Biomedical Engineering and Design Handbook Volume 1, Fundamentals
P. 197
174 BIOMECHANICS OF THE HUMAN BODY
FFT of the EMG Data
70
60
50
40
Power
30
20
10
0
0 50 100 150 200 250 300 350 400 450 500
Frequency (Hz)
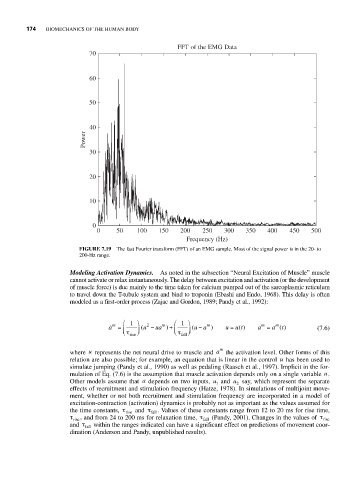
FIGURE 7.19 The fast Fourier transform (FFT) of an EMG sample. Most of the signal power is in the 20- to
200-Hz range.
Modeling Activation Dynamics. As noted in the subsection “Neural Excitation of Muscle” muscle
cannot activate or relax instantaneously. The delay between excitation and activation (or the development
of muscle force) is due mainly to the time taken for calcium pumped out of the sarcoplasmic reticulum
to travel down the T-tubule system and bind to troponin (Ebashi and Endo, 1968). This delay is often
modeled as a first-order process (Zajac and Gordon, 1989; Pandy et al., 1992):
⎛ 1 ⎞ ⎛ 1 ⎞
m
2
m
m
m
m
a = ( u − ua ) + ( u a ) u u = u t() a = a () (7.6)
−
t
⎜ ⎝ τ rise ⎟ ⎠ ⎜ ⎝ τ fall ⎟ ⎠
where u represents the net neural drive to muscle and a m the activation level. Other forms of this
relation are also possible; for example, an equation that is linear in the control u has been used to
simulate jumping (Pandy et al., 1990) as well as pedaling (Raasch et al., 1997). Implicit in the for-
mulation of Eq. (7.6) is the assumption that muscle activation depends only on a single variable . u
Other models assume that a depends on two inputs, u 1 and u 2 say, which represent the separate
effects of recruitment and stimulation frequency (Hatze, 1978). In simulations of multijoint move-
ment, whether or not both recruitment and stimulation frequency are incorporated in a model of
excitation-contraction (activation) dynamics is probably not as important as the values assumed for
the time constants, τ rise and τ fall . Values of these constants range from 12 to 20 ms for rise time,
τ rise , and from 24 to 200 ms for relaxation time, τ fall (Pandy, 2001). Changes in the values of τ rise
and τ fall within the ranges indicated can have a significant effect on predictions of movement coor-
dination (Anderson and Pandy, unpublished results).